25
3300 MHz
00 MHz
600 MHz
600 MHz
ε = 10.5
ε = 10.4
ε′ = 10.5
ε′ = 10.4
ssd.. = 4.2
..d = 4.2
s..d = 3.5
sd.. = 3.5
20
15
10
5
0
1
2
3
4
5
6
7
8
9
10 11 12 13 14 15 16 >17
Re at ve Permittivity ε′
Rellatiive Permittivity ((ε))
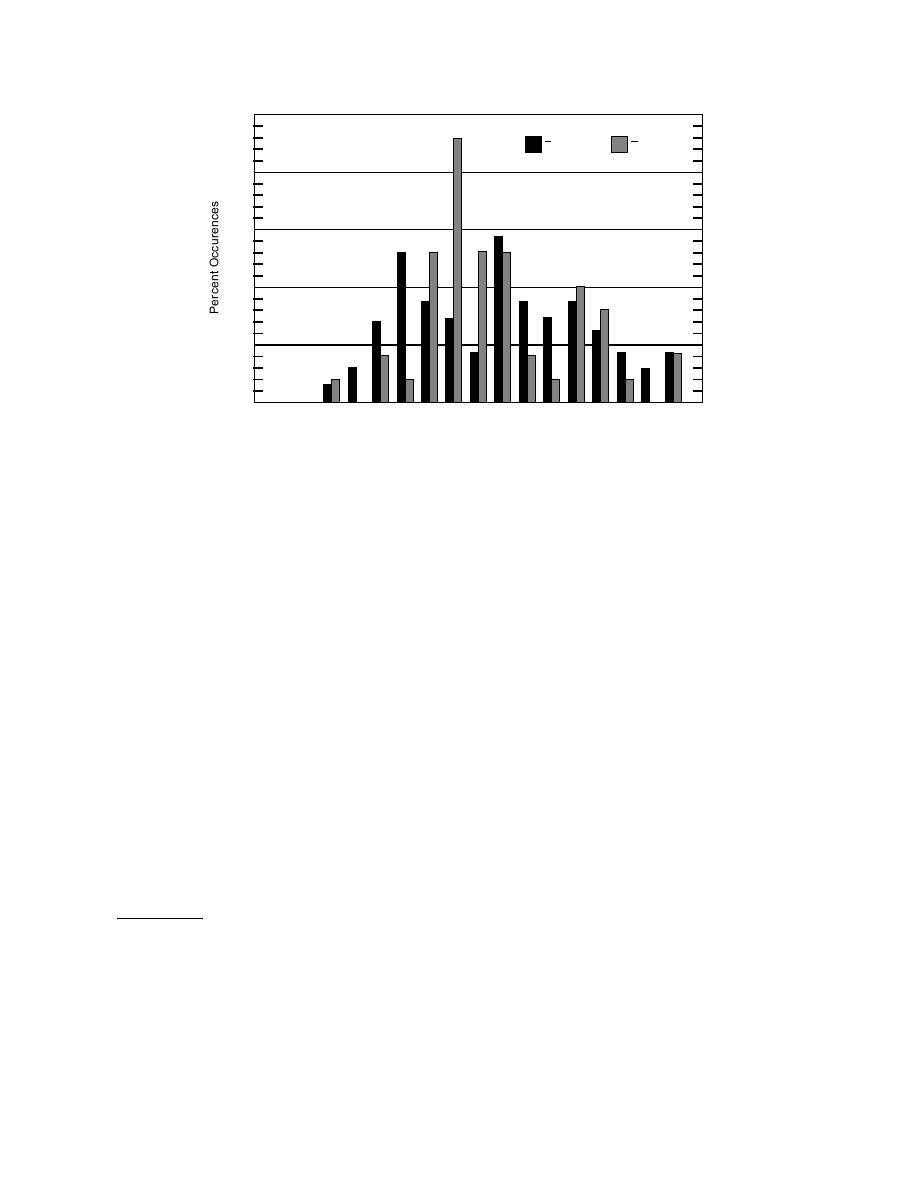
Figure 10. Distribution of ε′ at both 300 (black) and 600 MHz (grey).
low-permittivity material (e.g., ε′ = 4). Both wavelets
MODELING
then experience strong attenuation caused by conduc-
In this section we describe some basic modeling that
tivity alone (Fig. 12b) but maintain their original form
is intended to do two things: 1) demonstrate how the
in this case and show no shift in local frequency*. Fig-
specific kinds of scattering effects from elongated UXO-
ures 12c and d show that shifts in local frequency will
type targets can give systematic clues to the character
occur when the dielectric relaxation is considered.
of the target; and 2) show how such scattering can cause
Despite the shift, the wavelet form is changed little.
The value of ε′ also determines the antenna direc-
ambiguities in the pattern of measured signal. As an
entrance into modeling the kind of phenomena con-
tivity (Arcone 1995). Horizontal dipoles on the ground
fronted in the field, we constructed a simple integral
surface show a greater concentration of energy within
equation model of radar scattering in a uniform loessy
the subsurface vertical plane that includes the antenna
axis than in the plane perpendicular to the axis (Fig.
background. Our focus is on the kinds of fields radi-
13). As ε′ increases, the radiation will become more
ated from a dipole-type antenna, their interactions with
UXO-form targets, and the scattered signals that result.
confined within the plane containing the antenna axis.
We do not include complications here which may arise
This means that our profiles were mainly sensitive to
from the presence of a ground surface near the target,
the ground directly beneath the transects. The greater
but concentrate only on the transmissions and reflec-
width of the pattern perpendicular to the axis (and along
tions back and forth between the antenna and target.
our transects) shows that the rapid fading we observed
Elsewhere, using more sophisticated modeling tech-
within diffraction asymptotes was due to soil attenua-
niques (O'Neill et al. in prep), we treat targets with
tion and not to radiation directivity.
proximate ground surfaces. These latter investigations
generally reveal that basic resonance and polarimetric
scattering phenomena that we see here using the inte-
gral equation model (infinite homogeneous soil back-
*The distortion is small in all cases for our system model
ground) usually persist when the target is near the
(Fig. 12b, c, d, bottom) and the attenuation is comparable to
ground surface.
the gain we used during recording to bring reflections to the
Within the bounds of our assumptionsinfinite soil
level of the direct coupling. The shift in local frequency for
constituting a uniform background around the target
the ideal wavelet (Fig. 12c, d, top) is severe enough to pre-
we treat the physics of the antenna radiation and target
clude its detection by a receiver antenna identical to the trans-
scattering (re-radiation) rigorously. All governing rela-
mitter antenna. In contrast, the local frequency of our system
tions used here begin with statements tantamount to
model is lowered to only 300 MHz by the 3-GHz relaxation
Huygen's Principle (Kong 1990). To simulate both
frequency (Fig. 12c, bottom). A value of 6 GHz has less
effect (Fig. 12d, bottom).
radiation from the buried target and from the transmit-
15


 Previous Page
