0.5
6
8
9
10
12
13
ε Layer
0.4
Values
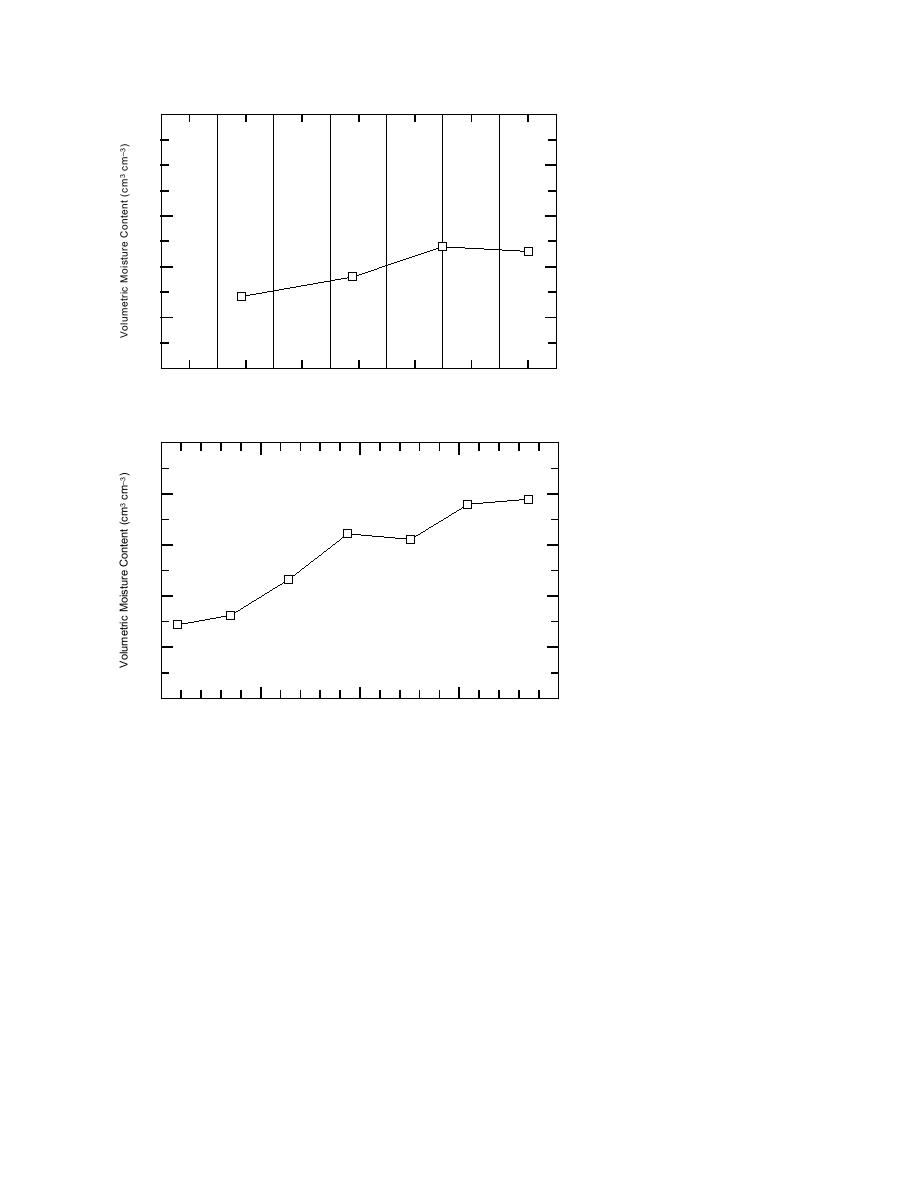
b. Profile 2.
0.3
0.2
0.1
0.0
0
10
20
30
40
50
60
70
Depth (cm)
0.5
0.4
0.3
Low-Volume
Sample
c. Profile 3.
0.2
Figure 5 (cont'd). Soil moisture pro-
files at five locations.
0.1
0.0
0
50
100
150
200
Depth (cm)
ε″, influences attenuation above 400 MHz (discussed
core obtained above the 58-cm-deep target showed a
later). Although ε″ was not measured, the high amount
moisture content that varied from 15% at 15 cm deep
to 24% at 5070 cm deep. According to Topp et al.
of gain used for the radar measurements indicates a high
(1980), these water contents correspond with ε′ values
attenuation rate for this soil and will be seen to be con-
sistent with the above range of σ.
ranging from about 7 (15%) to 12 (25%), which agrees
well with our values of 8.69.5 for this soil column. A
Grid survey: 300 MHz
time-of-flight analysis, in which we ascribed the
appropriate ε′ to 10-cm soil increments (Fig. 5b) and
The transect lines on the 40-acre site are superim-
posed on maps of target and ordnance distribution in
then calculated the time delay in each increment, gives
an effective ε′ value of 9.5.
Figure 3. The lines surveyed are designated as transects
Soil conductivity, σ, was measured at several sites
A, B, C, etc., and were 1300 ft (396 m) long. The class
by the Waterways Experiment Station (Llopis in prep).
of target (ordnance or nonordnance) is indicated on the
Using four-electrode Schlumberger soundings, concur-
map. Additional information regarding exact location
rent with our work, they found the soil resistivity struc-
and type of target, target depth, and approximate orien-
ture to be dominated by a near-surface, 2- to
tation is available. All ordnance are metal.
4-m layer with approximately 0.025 < σ < 0.04 s/m.
We show a typical 300-MHz profile segment before
These values strongly influence radiowave attenuation
and after horizontal background removal filtering in Fig-
below about 400 MHz, while the imaginary part of ε*,
ure 6. Intensity is linearly proportional to signal ampli-
8


 Previous Page
