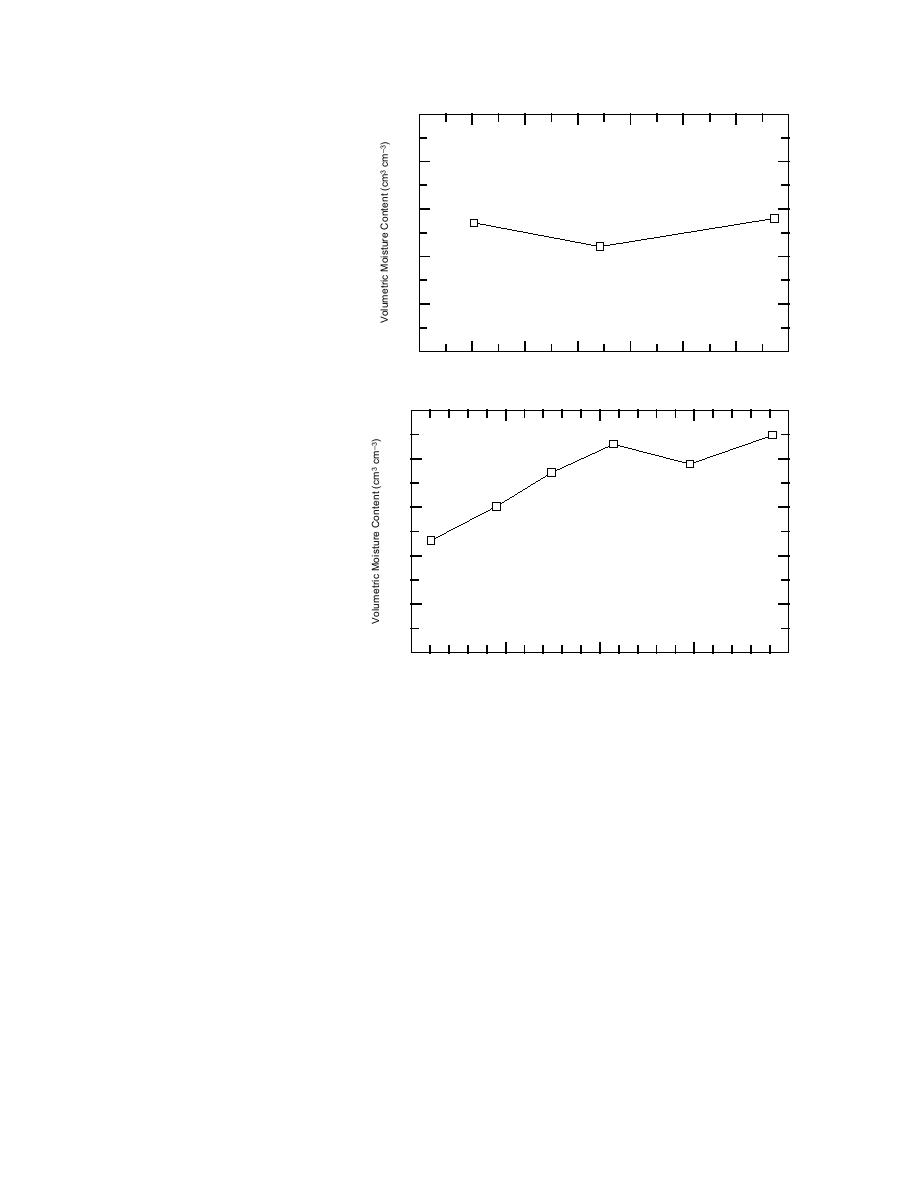
0.5
0.4
0.3
d. Profile 4.
0.2
0.1
0.0
0
10
20
30
40
50
60
70
Depth (cm)
0.5
0.4
0.3
0.2
Rain Day Prior to Sampling
e. Profile 5.
0.1
Figure 5 (cont'd).
0.0
0
50
100
150
200
Depth (cm)
tude in the profile. The time range of 50 ns, beyond
bolic diffractions (between 859 and 865 ft) and short
which noise became severe, corresponds to about 2.3
reflection segments. Although the background filter-
m of penetration for ε′ = 10.4, the average value
ing reduces the noise bands and the direct coupling, it
obtained at JPG (discussed later). The direct coupling
also attenuates many target responses, especially those
between antennas occupies about 8 ns of the record and
characterized by short reflection segments such as
masks part of the responses to some of the targets. The
occur near 926, 915, and 900 ft. The use of more traces
noise bands between about 30 and 40 ns are probably
(i.e., a wider "window") in the background filter would
caused by radiation leakage onto the cables that reflected
retain these reflection responses at the expense of less
back to the receiver and internal system mismatch
noise reduction.
reflections caused by either the high value of ε′ at the
In general, we detected a total of 30 high-amplitude
surface or poor system design. In both cases, erratic
targets along all 14 lines, of which 14 responses within
ground contact, caused by uneven topography and jerks
segments of these profiles are shown in Figure 7. The
in the towing, caused the amplitude of these bands to
phase structure of several of the target wavelets
vary and precluded the efficacy of horizontal filtering.
(transects C, left; G, left; K, left; and I) identifies them
No distinct and extended horizons indicative of soil
as being of higher impedance than the surrounding soil
stratification or a bedrock interface appear within the
matrix. They are therefore probably metal. Other target
23 m of radar penetration along any of our profiles.
wavelets have a phase structure opposite that of the
We use arrows to identify several targets of anoma-
metal response (transect F; transect K, right). We
lously high amplitude in the unfiltered profile of Fig-
presume these responses to be from the nonordnance
ure 6. These targets are characterized by both hyper-
9


 Previous Page
