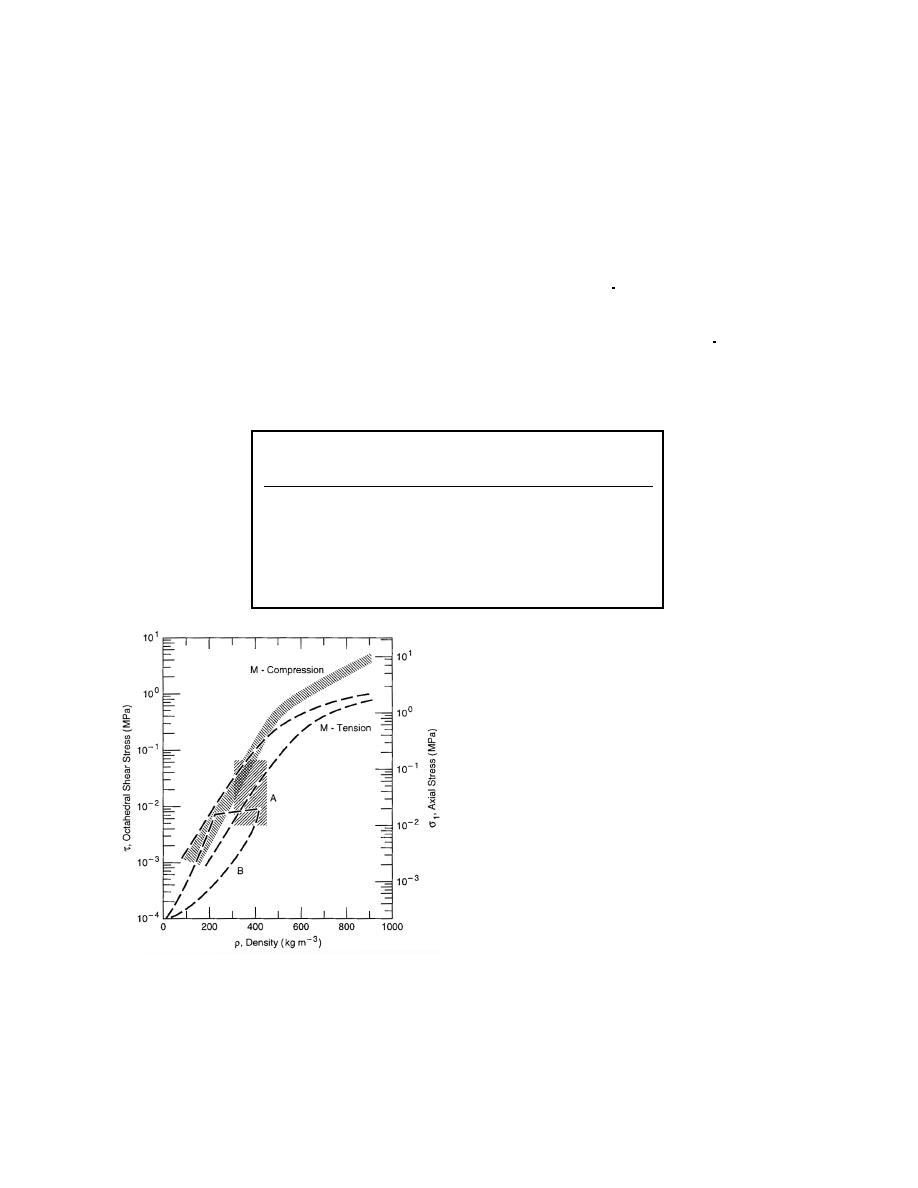
Using these graphs, for a snow density of 200
Fig. 23). The cap eccentricity parameter R was cho-
kg/m3, values ranged from c' = 2.14 kPa and φ' =
sen based on typical values for earth materials having
8.98 for the ring shear device to c' = 43 kPa and φ' =
a very steep compaction cap (R = 0.02 to 0.0001).
The transition surface radius α was set to 0.0 for no
14 using the CIV. Because of the nature of the test,
transition. The initial cap yield surface position εplol|
these values may be more representative of the inter-
0
v
face shear. However, similar values of cohesion (ap-
was arbitrarily set to 0.001 to allow initial softening.
proximately 2030 kPa) were reported in Shapiro et
For the foam model the initial yield stress in uni-
al. (1997). These values yield a DruckerPrager β
axial compression σ0 was based on data in Shapiro et
ranging from 15.2 to 22.5 and a d ranging from 3.7
al. (1997). The initial yield surface position in hydro-
to 72 kPa.
static compression pc|0 (for exponential hardening)
Parameters describing the shape of the cap were
was chosen to allow for initial softening or hardening
(about half the value of σ0). The hydrostatic tensile
adjusted based on model response. The flow stress
ratio K (ratio of tensile strength to compressive
strength pt was selected as 10% of pc|0 as a general
strength) was held at 1.0. This agrees with data pre-
rule for foam materials. M is calculated from the
sented in Mellor (1975) and Shapiro et al. (1997),
other input parameters.
indicating nearly equal values of compressive and
These material parameters were refined based on
tensile strength for low-density snow (data set M in
model response and are presented in Table 1.
Table 1. Initial material model parameters.
DruckerPrager cap
Foam
Elastic
λ = 0.35
κ = 0.005
d = 5,000 to 30,000 Pa
β = 22.53
ν = 0.3
pc|0 = 113.76 Pa
εplol|0 + εplol| = 0.0005
+
pel = 11.376 Pa
R = 2.2E-2 to 1.1E-4
v
v
t
εplol|0 = 0.001
pc|0 + pt = 113.76 Pa
E = 13.79 MPa
v
α = 0.0
pt = 11.376 Pa
σ0 = 275.79 Pa
K = 1.0
K = 1.0
Hardening. Two methods were used to handle the
hardening data: 1) using an exponential hardening
function and 2) using tabular data. For exponential
hardening, the slope of pure hydrostatic compression
behavior λ is obtained by plotting the void ratio
against ln[(p + pt)/pt], as shown in Figure 14, where p
is the hydrostatic pressure and pt is the strength in
hydrostatic tension. For the snow pressurevolume
relationship, void ratio was plotted against ln(p) since
pt was not precisely known. For snow, pt is a very
small quantity and only the slope is required, which
is minimally affected when p>>pt. These plots were
generated using the compression test data published
in Abele and Gow (1975).
Values for the logarithmic hardening modulus
were calculated using three different compression
tests of similar snow density, along with values cal-
culated from the final pressuredensity pairs of an
additional 21 tests, all from Abele and Gow (1975).
= Strain rates greater than 5 104 s1
A
Since the measurements are from one-dimensional
= In-situ tensile strength
B
compression or consolidation (oedometer) tests by
= Uniaxial compressive and tensile strength
M
application of a vertical load to a sample within a
under rapid loading
rigid cylinder (i.e. uniaxial strain), the calculation of
the mean hydrostatic pressure p is not straightfor-
Figure 23. Compilation of uniaxial strength data.
ward. One approximation calculates the horizontal
[After Mellor (1975) and Shapiro et al. (1997).]
15


 Previous Page
