p = 0.413σ1 .
stresses σh based on earth pressure theory assuming
(24)
that they are related to the vertical stress σv by a fac-
Using this expression to calculate the mean stress
tor of K0, known in soil mechanics as the earth pres-
from individual uniaxial consolidation tests with a
sure coefficient, where
density of 200390 kg/m3 (Abele and Gow 1975,
σh = K0σv .
(21)
tests 3, 10, and 29) results in a range of λ between
0.223 and 0.454.
The earth pressure factor can be calculated from
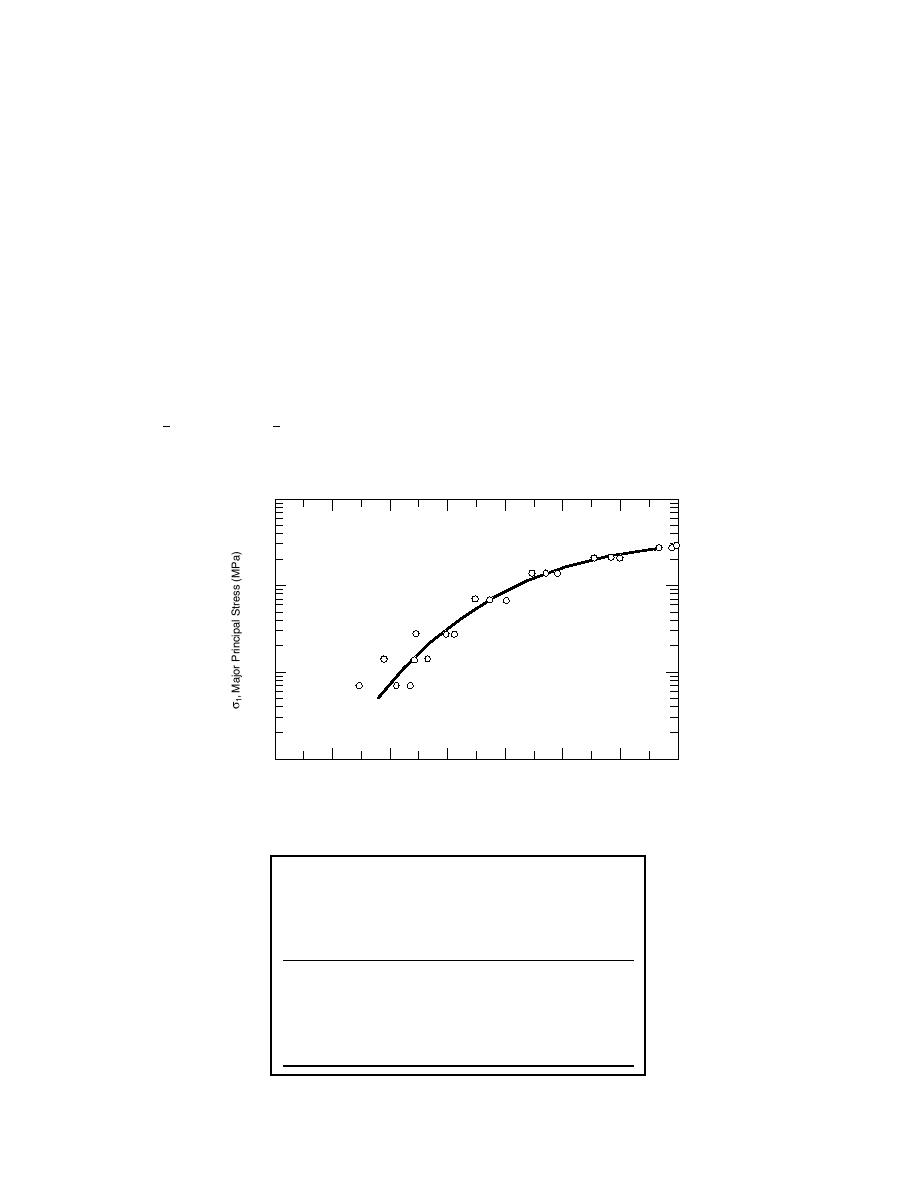
An additional data set was obtained using the
the friction angle using
combined data from 21 consolidation (oedometer)
K0 = 1 - sin ϕ .
tests on snow with initial densities of 200220 kg/m3
(22)
and temperatures of 0 to 3C. These data are shown
Based on Alger's shear measurements (Alger
in Figure 24 and fall within the expected range of
1988, Alger and Osborne 1989), the average K0 value
stressdensity data for snow shown in Figure 25.
is approximately 0.12. Assuming that the maximum
Selected points from the best-fit line of these data
principal stress is vertical (as would be expected in
were used to calculate the values in Table 2 and are
uniaxial compression tests on undisturbed snow) and
plotted in Figure 26 to obtain an average λ of 0.33.
using equations 8 and 21:
The hardening table data were taken from an aver-
age of Abele and Gow tests on warm, 200-kg/m3
(σ1 + σ2 + σ3 ) = 1 (1 + 2K0 )σ1
p=
1
(23)
3
3
snow (tests 10 and 29) and are given in Table 3.
which, for K0 = 0.12, reduces to
4
10
ρ0 = 200 to 220
3
10
2
10
1
10
200
300
400
500
600
700
800
900
ρ, Density (kg m3)
Figure 24. Compression of natural snow at 0 to 3C. (After Abele
and Gow 1975.)
Table 2. Pressurevolume data calculated from the
3
Abele and Gow (1975) data set for 200- to 220-kg/m
snow at 0 to 3C.
σ1
p = 0.413 σ1
ρ
Void ratio,
3
(kg/m )
(MPa)
(MPa)
ln p
e
900
2.8
1.16
0.15
0.00
770
2
0.83
0.19
0.17
620
1
0.41
0.88
0.45
540
0.5
0.21
1.58
0.67
470
0.2
0.08
2.49
0.91
410
0.1
0.04
3.19
1.20
380
0.05
0.02
3.88
1.37
16


 Previous Page
