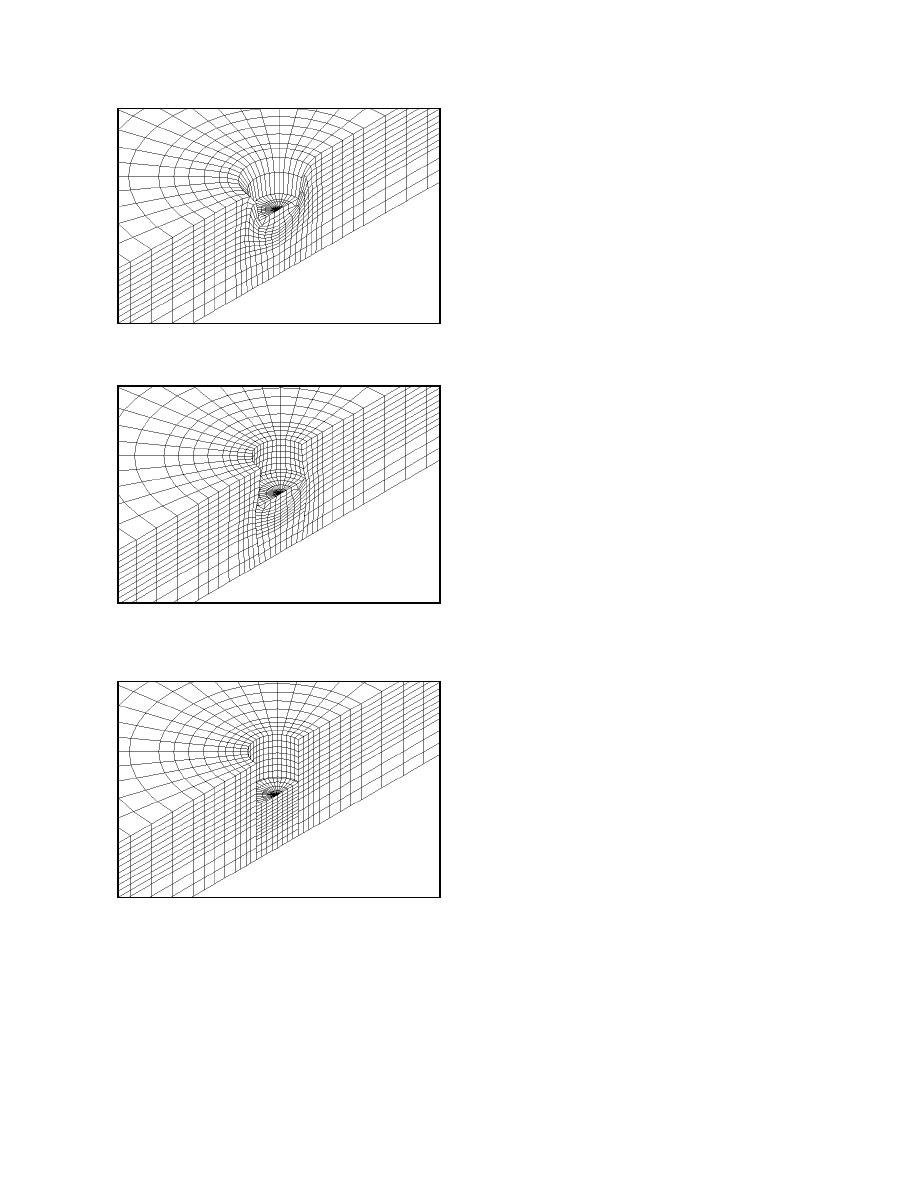
plate and snow. The deformed meshes for each of the
models of the field test are shown in Figure 28. Fig-
ure 28b clearly shows the effect of the shear surface
on the sides of the plate, with the model deforming
similarly to field observations, compared to the unde-
sirable element distortion along the sides of the plate
when these elements are not allowed to slide (Figure
28a). In future models, adaptive meshing, where the
mesh adjusts to accommodate large distortions,
should help alleviate the problem of excessive distor-
tion without the use of the shear contact surface. Also
clearly seen in Figure 28 is the lateral deformation of
the snow beneath the plate in the DruckerPrager cap
a. DruckerPrager cap material.
models (Fig. 28a and b), but no lateral deformation is
seen in the crushable foam model (Fig. 28c).
The forcedisplacement curves for the plate mov-
ing into the snow are compared to the experimental
measurements in the laboratory and field in Figure
29. The model matches the controlled laboratory test
well, particularly for the DruckerPrager cap model.
In the field test the hardening behavior was difficult
to simulate. The laboratory test was not run to maxi-
mum resistance and would be similar to a "deep
snow" condition, while the plate in the field test was
pushed to ultimate resistance, causing compaction
equivalent to a "shallow" snow condition.
Snow density can be calculated from the modeled
volumetric plastic strain using the hardening tables
b. DruckerPrager cap with vertical shear contact
and the pressurevolume relationships in Tables 2
surface.
and 3. The snow density values from the models are
shown in Figure 30. These densities can be compared
to snow densities measured under the plate, as shown
in Figure 31. The maximum volumetric inelastic
strain in the plate sinkage model occurred in isolated
locations adjacent to the plate at values of approxi-
mately 0.5, which is equivalent to a snow density of
420 kg/m3, whereas very dense snow (440520
kg/m3) was measured up to 5 cm below the plate
(Fig. 31). These values correspond to a strain of 0.5
m/m or greater (assuming primarily vertical deforma-
tion) on the uniaxial stressstrain model calibration
curve (Fig. 27). The divergence of the models and
data at strains greater than 0.5 m/m (Fig. 26) would
account for density discrepancies in the plate sinkage
measurements and models in high strain areas. On the
c. Crushable foam with shear contact surface.
whole, however, most of the strain occurs at levels of
0.4 or less, so the model provides a good fit to the
Figure 28. Deformed meshes for field plate sink-
age simulations.
overall plate sinkage behavior.
The laboratory tests were also used to evaluate the
lateral deformation of the snow, since field observa-
tions show lateral deformation under a vehicle load.
The plate was lowered by constraining the surface
On closer examination of the literature, however, few
nodes radially while displacing them into the snow,
examples were available where the snow had been
effectively creating a no-slip contact between the
19


 Previous Page
