3,500,000
3,000,000
2,500,000
2,000,000
1,500,000
1,000,000
500,000
0
0
100
200
300
400
500
600
Concentration (mg/L)
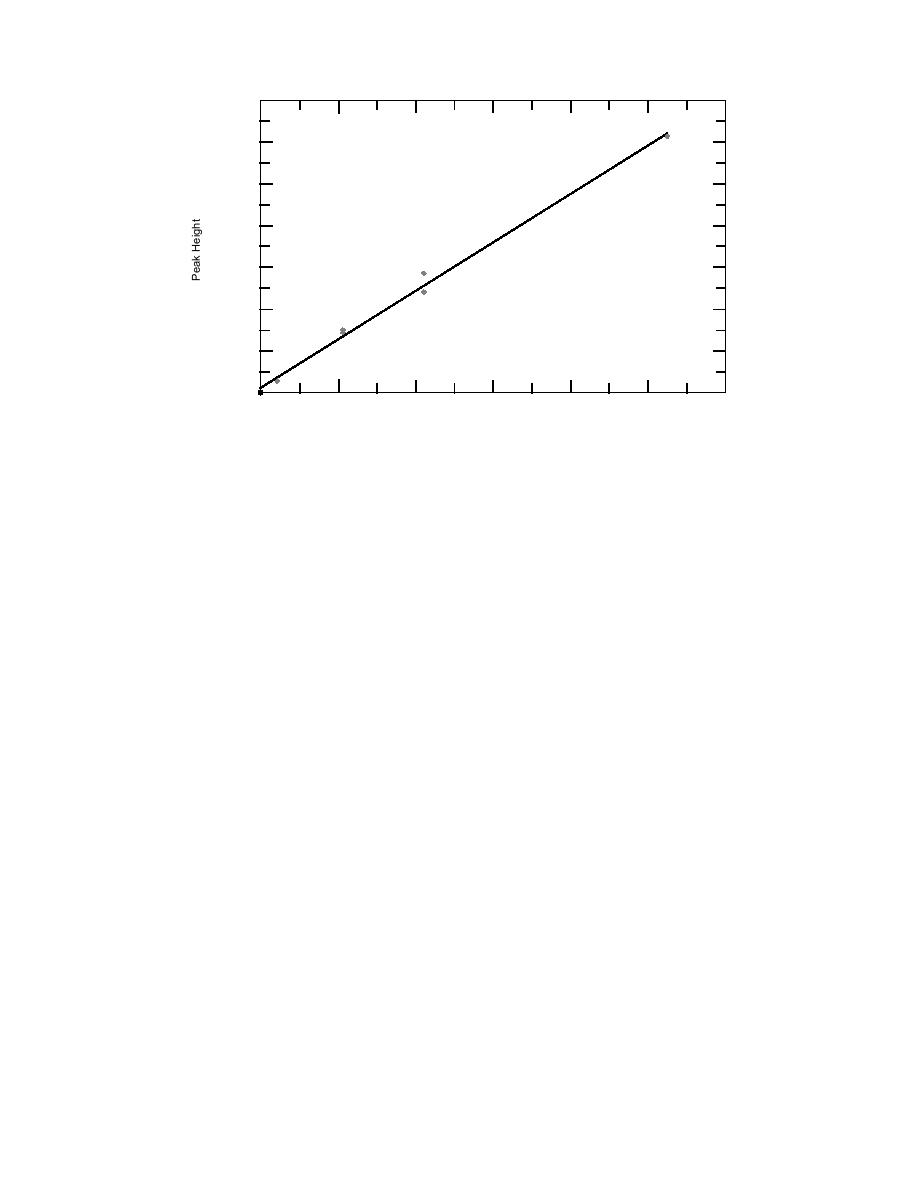
Figure 6. Initial calibration curve for the analysis of phenol by HPLC-UV.
All dilutions were made using reagent grade
Preparation sections of the TCE analysis for details.
water in 25-mL volumetric flasks. The stock stan-
Sample preparation
dard and each calibration solution were analyzed in
Samples for phenol were prepared for analysis
duplicate. The integrated peak area was plotted
by passing them through a Millex-HV (0.45-m)
against the concentration of the solutions. A model
disposable filter. Aliquots of the filtered samples
was fitted to the data using linear regression. The
were transferred to HPLC autosampler vials using
data show that the response is linear up to 525 mg/L
Pasteur pipettes.
(Fig. 6).
Sample analysis
Daily calibration
All phenol standards and samples were anal-
An analytical standard was prepared by dissolv-
yzed using the HPLC system described above. The
ing 35 mg of phenol in reagent grade water and
autosampler was programmed to flush the sam-
diluting to 100 mL in a volumetric flask. The result-
pling loop for 20 seconds at a rate of 0.5 mL/min.
ing concentration was 350 mg/L. This standard
The samples were then injected onto an LC-18 col-
was used throughout the project for daily calibra-
umn eluted with 1:1 (v/v) water/methanol.
tion. Each day of analysis, three aliquots of the stan-
Detection was performed with a UV detector set at
dard were analyzed, two at the start and one at the
254 nm. The chromatogram was recorded by the
end of the analysis. A peak area response for the
Hewlett Packard digital integrator programmed to
phenol was recorded for each replicate and the
integrate peak areas.
mean peak area response was calculated. The daily
response factor was calculated by taking the ratio of
Calculations
the mean peak area response over the concentration
Daily response factor was calculated as
of the standard. The resulting units for the response
described above. The concentration of phenol in
factor are peak height per milligram per liter.
the water samples was calculated by dividing the
peak height response for the sample by the daily
Sample collection
response factor
Two samples from each column were collected
daily for phenol analysis during the remediation
[phenol]j = (peak height)j/(response factor) (3)
phase of the test. These samples consisted of the 12-
mL aliquots that were removed from each vial
where (j) denotes the analyzed sample. This resulted
when the samples were prepared for headspace
in a concentration value in the units of milligrams
analysis. Refer to the Sample Collection and Sample
per liter in the water sample.
8


 Previous Page
