500.0
450.0
Column 1
400.0
Column 2
350.0
300.0
250.0
200.0
150.0
100.0
50.0
0.0
10
0
2
4
6
8
12
14
16
Time (days)
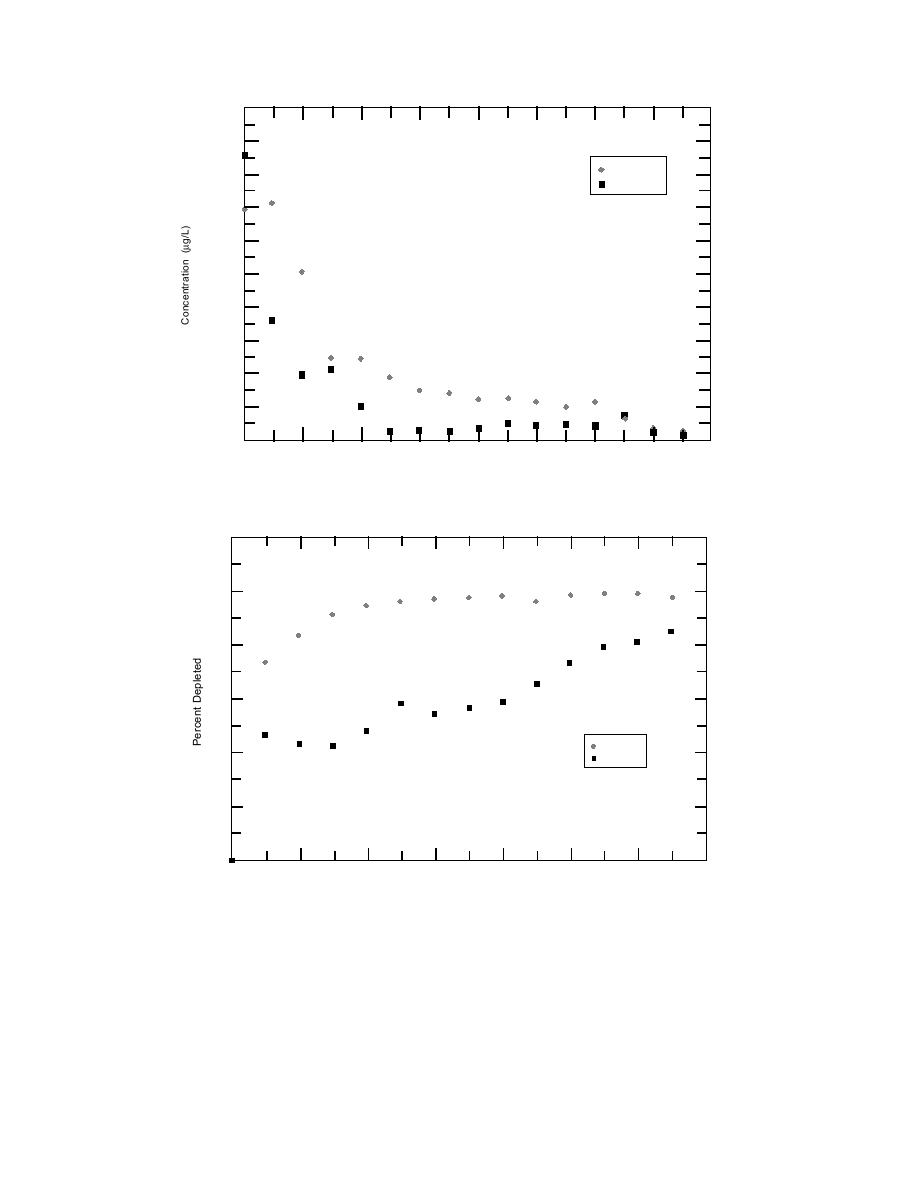
Figure 10. Remediation curve for TCE in water for round 2, columns 1 and 2.
120
100
80
60
Column 3
40
Column 4
20
0
2
4
6
8
10
12
14
Time (days)
Figure 11. Remediation curve for TCE in water for round 2, columns 3 and 4.
ation of columns 3 and 4 of round 2, the concentra-
umns had 2200 g of adsorbent material. Based on
tion of TCE in column 4 was not being reduced
the average concentration change for each remedi-
significantly (Fig. 11). Additional biomass was
ation cycle, the mass of TCE actually removed
added, but the remediation process remained
from the system was only 58 mg per column.
slow, although laboratory testing of a water sam-
During the course of this pilot study, we
ple from columns 3 and 4 confirmed the presence
observed two factors that seemed to have a direct
of viable G4 microorganism. When the bioreactors
effect on the remediation rate. The first was the
were being set up for the next remediation, a fail-
removal of the carbon dioxide. During the remedi-
12


 Previous Page
