Table 5. Summary of clay remediation data.
water was determined daily, primarily to ensure
that the system was operating properly. The con-
Starting
Ending
centration of phenol was monitored because the
conc.
conc.
Percent Number
(g/g) remediated of days
(g/g)
microbiological system required that a minimum
Round Column
concentration of phenol be maintained in the reac-
1
1
43.5
<d
99.9
15
tors for the process to continue. The chloride con-
2
57.1
<d
99.9
15
centration was monitored to demonstrate the min-
3
32.4
8.29
74.4
15
eralization of the TCE and for mass balancing.
4
36.6
8.56
76.6
15
2
1
21.0
5.81
72.3
15
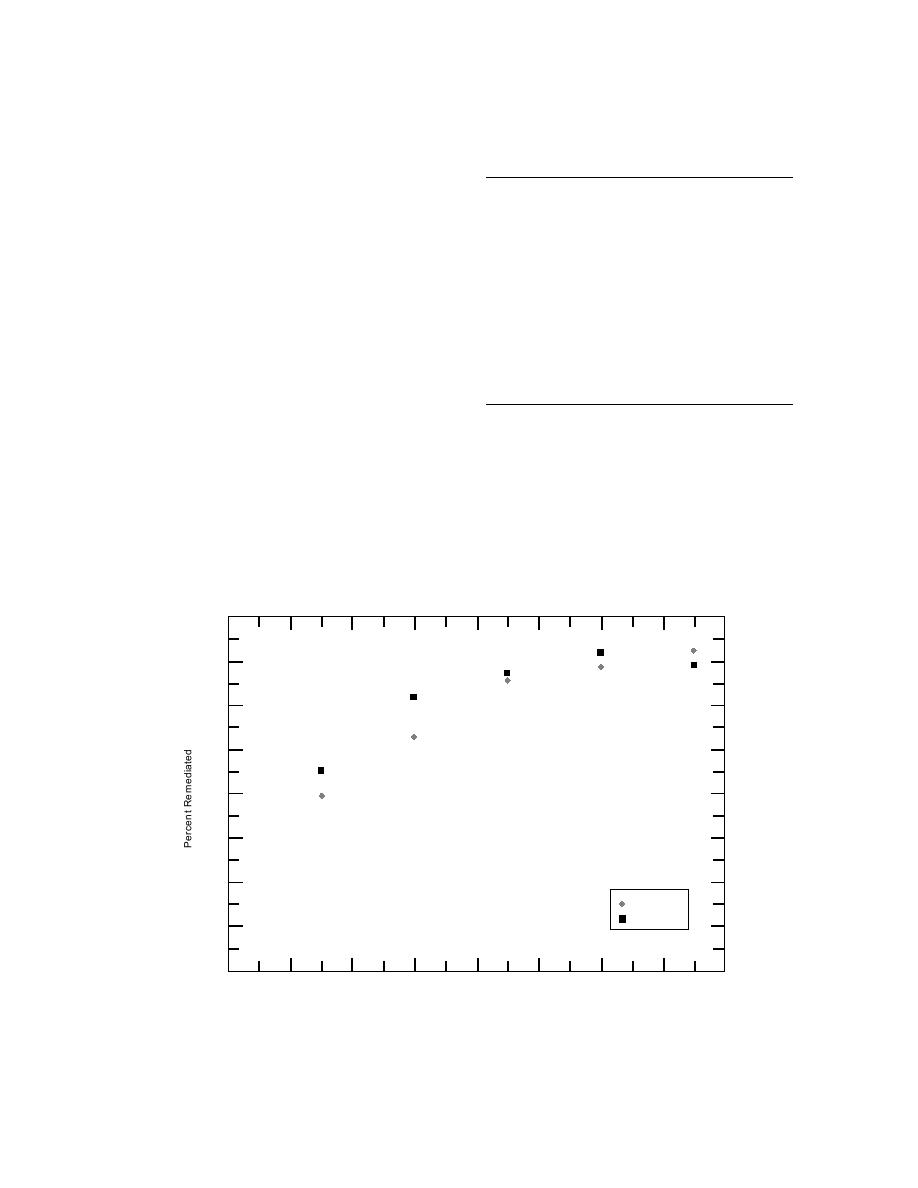
The clay data were examined in two ways:
2
22.2
6.91
68.9
15
absolute concentration vs. time (Fig. 9a) and rela-
3
30.9
6.20
80.1
12
tive concentration vs. time (Fig. 9b). The data are
4
23.5
10.8
54.2
12
summarized in Table 5. The concentration data for
3
1
32.2
6.20
80.8
12
the TCE in water were also plotted vs. time (Fig.
2
33.6
8.50
74.7
12
3
28.6
5.47
80.9
9
10).
4
26.9
6.63
75.3
9
The data show that the average absolute con-
mean
32.4
6.11
78.2
13
centration of TCE in the clay was reduced by 26.3
std. dev.
10.1
3.23
12.4
g/g across all the rounds of the study. This
amounts to an average percentage reduction of
not on the surface of the clay, and the concentra-
TCE in the clay of 78.2%, with a relative standard
tion in the water drops at a faster rate than that in
deviation of 16%. These data suggest that the
the clay during the first few days of the remedia-
adsorbent material can be remediated and that the
tion process. If the remediation were limited by the
process was reproducible. The average time
microbiological process, we would see the concen-
required for the remediation phase was 13 days.
tration in the water remain relatively constant as
A comparison of the concentration data vs. time
long as there was TCE desorbing from the clay.
for the clay and water samples suggested that the
In addition to a desorption limitation, the data
remediation process was desorption limited. The
also suggested a mass limitation. Each of the col-
microbiological process takes place in the water,
80
70
60
50
40
30
20
Column 1
Column 2
10
0
0
2
6
8
10
12
14
16
4
Time (days)
b. Percentage remediated vs. time.
Figure 9 (cont'd).
11


 Previous Page
