influent concentration was greater than 0.85 or
In addition to monitoring the system's perfor-
when an asymptotic level was maintained for 24
mance through analyses of clay samples for TCE
hours. The effluent from the columns was passed
and water samples for TCE and phenol, we moni-
through activated carbon canisters and disposed of
tored the dissolved oxygen level and metered it to
at CRREL's treatment facility for water contamin-
introduce additional oxygen as needed. The sys-
ated with TCE.
tem was programmed to add oxygen to 15% of sat-
Once loaded, the columns were taken off line and
uration when the level dropped below 5%. Upon
connected to the closed loop system, which included
determining that the material was rejuvenated, we
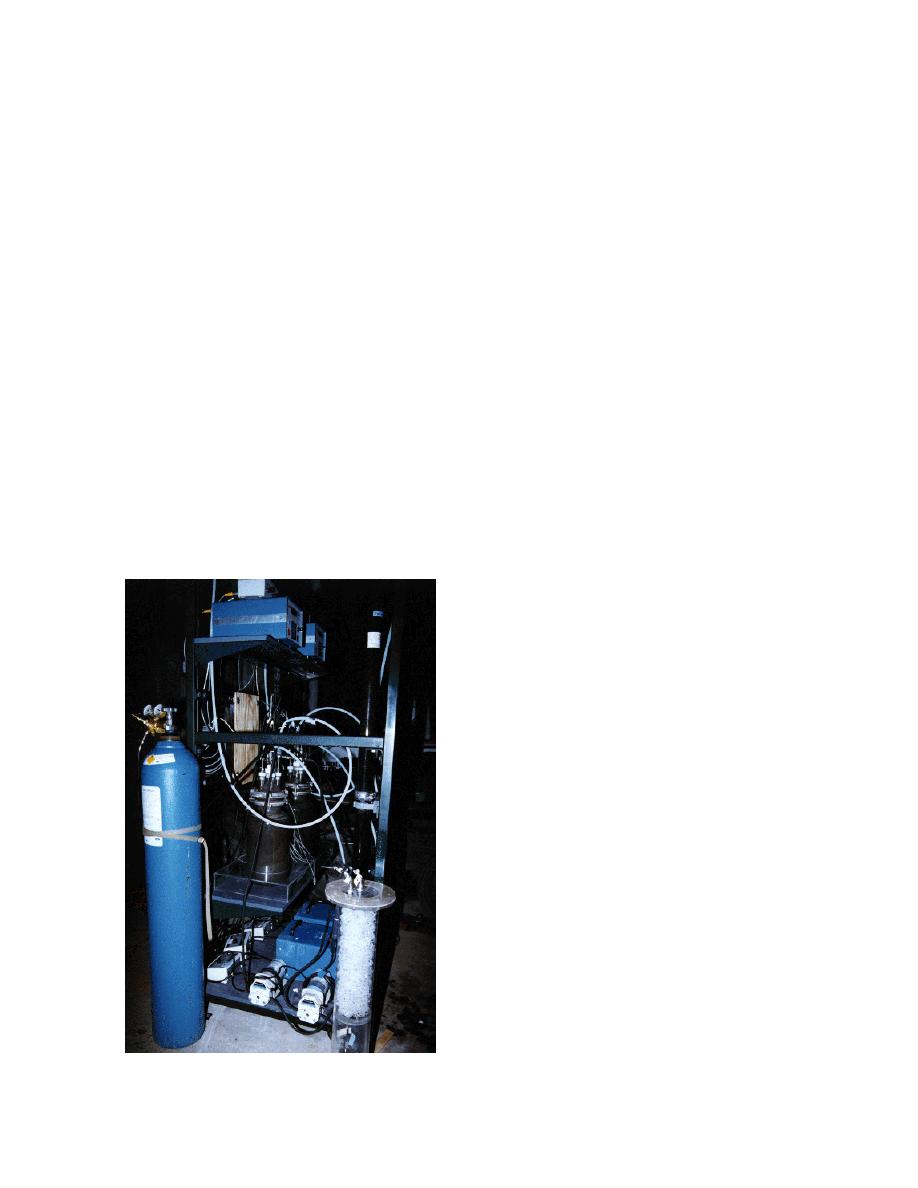
the bioreactors. The bioreators (Fig. 4) contained the
switched the system back to the loading mode and
G4 microbe in 9 L of a mineral salt solution and 8 g
the bed was reloaded with TCE-contaminated
of phenol. The initial phenol concentration in the
reactor was 500 mg/L. The clay beds were fluidized
During the pilot study, each column was loaded
by pumping the solution in the bioreactor through
and remediated three times. One "round" of the
the columns at a flow rate of 1.6 L/min. The effluent
study was defined as the loading and rejuvenation
from the columns flowed back to the bioreaction
of all four columns (i.e., round 1, skid 1 consisted
vessel. Determinations of the TCE concentration in
of loading and rejuvenating columns 1 and 2). In
the water and on the clay, as well as the concentra-
addition to monitoring the TCE, phenol, and oxy-
tions of the phenol and chloride in the water, were
gen concentrations, the system was also moni-
made following the schedule outlined in the Sample
tored for mechanical functioning and perfor-
Collection section. If the concentration of phenol in
mance, including pump maintenance and repair of
the water dropped below 60 mg/L, 8 g of phenol
failed tubing.
was added to the system. The clay material was con-
The pilot study was run from 9 September to 31
sidered "rejuvenated" when the TCE concentration
December 1996. The skids were originally en-
on the clay was reduced by 75% from the initial con-
closed in a wooden framed structure covered with
centration.
plastic sheeting. Because of a drop in the outside
air temperature to below 0C, the system was
moved into a building that was maintained at
4.5C.
EXPERIMENTAL METHODS
Analysis for TCE
All of the analyses for TCE were performed
using a head space gas chromatography (HS-GC)
system composed of the following components:
An SRI 8610A gas chromatograph equipped
with a megabore capillary column, Restek
MXT-1 (15 m 0.53 mm, 5.0-m film thick-
ness), and a photoionization detector (PID).
The carrier gas was He run at a column head
pressure of 8.5 lb/in.2 (59 kPa).
A Tekmar 7000 headspace autosampler
equipped with a 1.0-mL sampling loop.
An IBM compatible 386 computer running
Peak Simple 2 software for system control.
Autosampler vials were equilibrated for 24
minutes at 30C. An aliquot of gas from the head-
space was flushed through the 1.0-mL sample
loop, overfilling the loop. The sample was then in-
jected onto the head of the column where the ana-
Figure 4. Bioreactor used in the pilot scale study.
lytes were chromatographically resolved using an
4


 Previous Page
