isocratic temperature program at 100C. The peaks
Table 2. Concentration of initial cali-
bration standards.
in the chromatogram were integrated and the re-
sults were reported as measured peak heights.
Volume
Final
Standard
Stock
(mL)
(mg/L)*
Chemicals
1
high
50
29,000
Reagent grade trichloroethylene from Fischer
2
high
30
17,400
3
high
10
5,800
Scientific was used to prepare the analytical stan-
4
low
50
2,320
dards. Analytical grade water was purified by a
5
low
30
1,390
Milli-Q Type 1 Reagent Grade Water System (Mil-
6
low
10
464
lipore Corporation). HPLC-grade methanol used
* Concentration of TCE in the water.
to prepare the analytical standards was obtained
standards were used to prepare the initial and
from Sigma-Aldrich.
daily calibration standards for analysis (Table 2).
Preparation of stock standard
Initial calibration
A high standard solution was prepared by
For the initial calibration, six standards were
diluting 0.145 g of TCE to 25 mL with methanol in
prepared. Standards 13 were prepared by inject-
a volumetric flask, yielding a concentration of 5.80
ing 50, 30, and 10 L of high standard, respectively,
g/L. A low standard was prepared by diluting
into 10 mL of water in a headspace autosampler
0.0116 g TCE to 25 mL with methanol, resulting in
vial, as described in the previous section. Stan-
a concentration of 0.464 g/L. The standards were
stored at 4C, with the stoppered joints wrapped
dards 46 were prepared by injecting 50, 30, and 10
L of low standard, respectively, into 10 mL of
with Parafilm to retard evaporation.
water as previously described. The concentration
of TCE in the standards is listed in Table 2.
Preparation of analytical standards
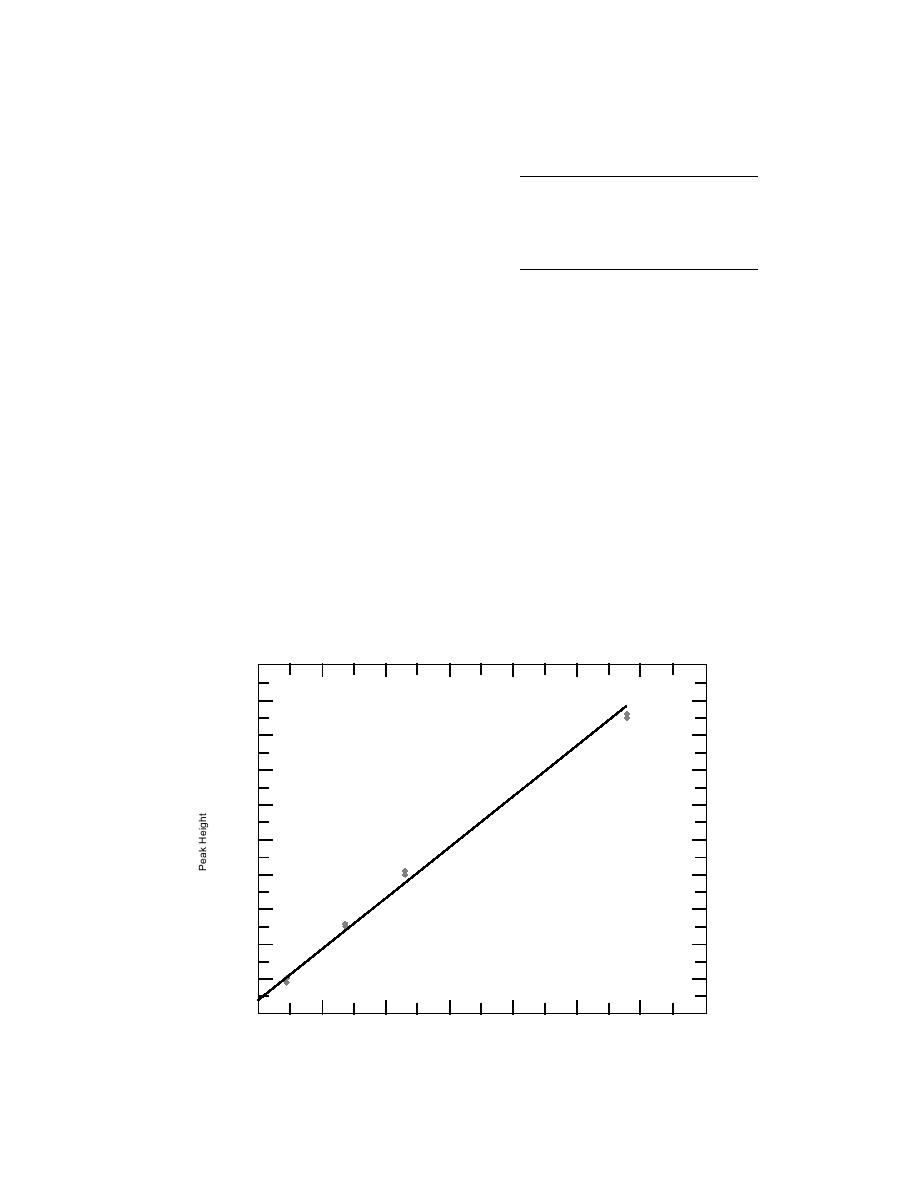
Each calibration standard, as well as a blank,
Analytical standards were prepared by adding
was analyzed by gas chromatography with photo-
10 mL of reagent grade water to a 22-mL head-
ionization detection (GC/PID) in duplicate in a
space autosampler vial, then capping the vial. The
random order. The measured peak height was
vial was then inverted and an aliquot of the stock
plotted against the concentration of the standard.
standard was injected into the water through the
A linear model was fitted to the data using simple
septum via syringe. Different volumes of the stock
10000
9000
8000
7000
6000
5000
4000
3000
2000
1000
0
0
1000
2000
3000
4000
5000
6000
7000
Concentration (g/L)
Figure 5. Initial calibration curve for TCE analysis by GC/PID.
5


 Previous Page
