

selection criteria at this stage were chiefly
Table 5. Chemical composition of best admixtures tested
in Phase 1.
based on the strength developed at seven
days of cure at 5C. In these graphs each
Antifreeze admixture
Dosage
Water/cement
mixture is identified by a code. The first two
Mix no.
formulation
(% CWT)
ratio
characters indicate the task number for which
1A_1*
Control admixture-free
0
0.48
the test results were obtained followed by
1A_20
KC1 (3 parts of sodium nitrate
the mix number used in the corresponding
+ 1 part of sodium sulfate)
8.0
0.48
task. Figures 1a through 1d display the test
1B_19
CCSN
4.0
0.48
results at 20C, 5C, 10C, and 20C. Two
1D_4
K2CO2 + lignosulfonate
6.0/1.5
0.38
1D_7
Ca(NO2)2 + NaNO2
3.0/3.0
0.48
control curves corresponding to admixture-
CM-48†
6.0
0.48
1E_5
free concrete are included for reference. One
CM-42†
1E_3
6.0
0.48
corresponds to concrete cured at 20C. The
Ca(NO2)2 + WRDA-19**
1F_8
4.0/0.7
0.40
second corresponds to concrete cured at 5C,
DP†
6.0
0.43
1H_2
†
the lowest temperature currently covered by
1H_6
DPTC
6.0
0.43
the ACI 306 specification. Table 5 shows the
* 1A_1 means mix number 1 in task 1A.
chemical composition of the selected admix-
† Code name used only to protect proprietary rights.
tures. The admixtures subject to proprietary
** WRDA-19 is a high-range water-reducing admixture commercially
available from W.R. Grace, Inc.
rights are identified by their code name only.
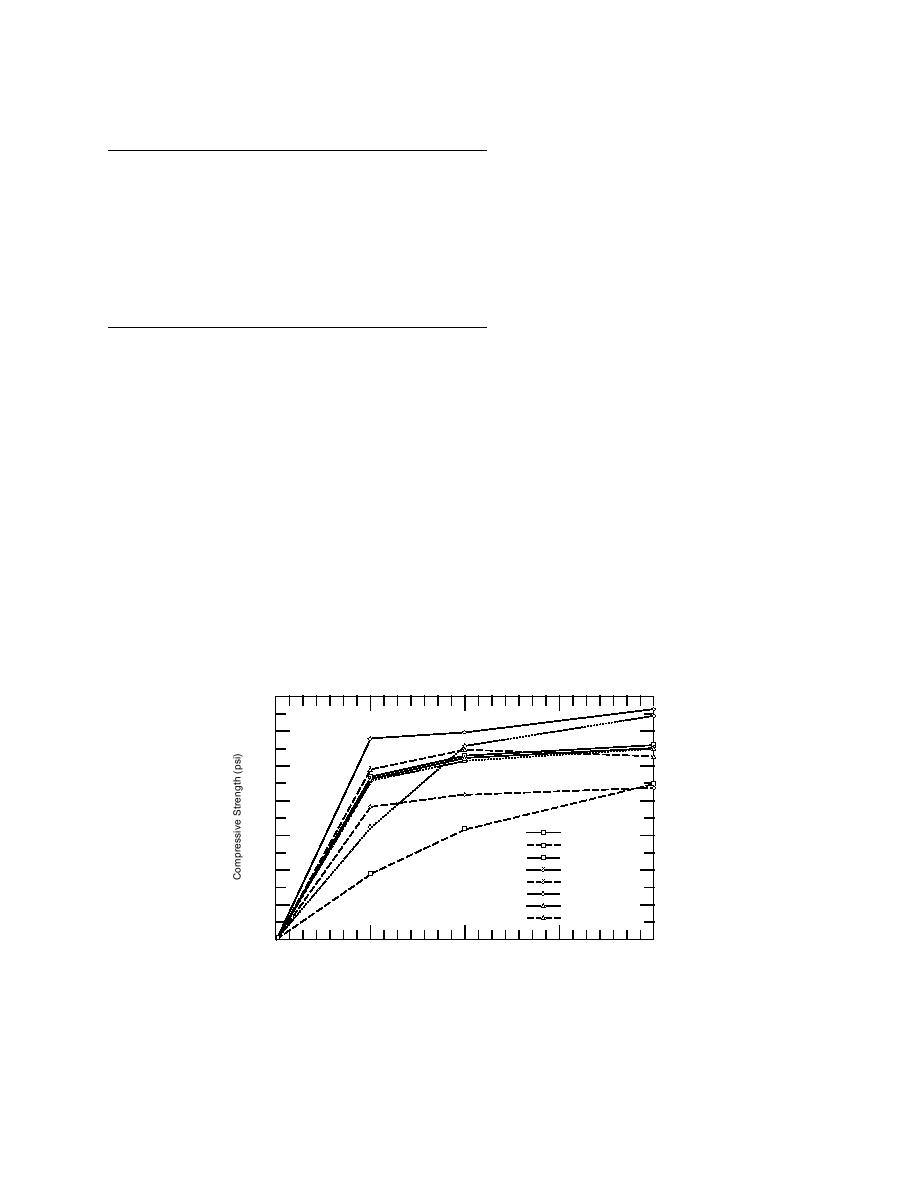
Figure 1a, corresponding to a curing tem-
mens cured at 5C that was equal to or better
perature of 20C, shows that CCSN (Mix No.
than that of nonadmixture concrete cured at 5C.
1B_19) enhanced the strength of concrete for at
The admixtures that developed higher strength at
least the first 28 days. The admixture Ca(NO2)2 +
5C were selected for further testing in Phase 2.
NaNO2 (mix 1D_7) caused lower strength at seven
It is important to note that these temperatures are
days, but higher strength at 14 days and thereaf-
at the center of mass of concrete cylinders. In ac-
ter. The admixture K2CO2 + lignosulfonate (mix
tual concrete structures, the air temperature can
1D_4) reduced the strength at all times, at least up
be significantly lower without harming the con-
to 28 days. The rest of the admixtures did not
crete because of the effect of the internal heat of
have a significant effect at room temperature.
hydration.
Figure 1b, corresponding to a curing tempera-
ture of 5C, shows that most of the selected ad-
Analysis of Phase 1 test results
mixtures allowed concrete strengths to be between
the values for the 20C and 5C control concrete.
The strength performances of the selected ad-
mixtures are presented in the figures below. The
Any strength developed at low temperature that
7000
6000
5000
4000
Control +20C
3000
Control +5C
1A 20
2000
1B 19
1D 4
1D 7
1000
1E 5
1E 3
0
0
7
14
21
28
Concrete Age (days)
a. 20C.
Figure 1. Compressive strength of best admixtures of Phase 1 cured at
various temperatures. Mixes 1F_8, 1H_2, and 1H_6 were not tested at
20C.
4

 Previous Page
