Table 3. Results of GC analysis for WP in water column above simulated dredge spoils.
WP mass (g)*
Hour
Label
Peak ht.
Standard (70 g/L)
1
S-1
185
0.0082
1
S-2
175
0.0077
Peak Ht.
1
S-3
200
0.0088
4994
1
S-4
263
0.0116
4433
1
S-5
180
0.0080
5201
1
S-6
0
ND†
4893
2
S-1
0
ND
4799
2
S-2
0
ND
4694
2
S-3
0
ND
4188
2
S-4
0
ND
4765
2
S-5
0
ND
Average = 4745.875
2
S-6
0
ND
RF [peak ht/mg/L)] =
67.8
4
F-1
0
ND
4
F-2
0
ND
4
F-3
0
ND
4
S-1
0
ND
4
S-2
0
ND
4
S-3
0
ND
4
S-4
0
ND
4
S-5
0
ND
4
S-6
0
ND
*34-mL aliquot of water extracted with 3.0 mL isooctane.
†Not detected; detection limit 0.006 g.
sure that WP particles in the target range are no
the side of the sedimentation tube starting after
longer suspended in the water column (≈ two
one hour of settling. The results, shown in Table 3,
hours), the supernatant must be decanted. To do
indicate that no WP particles were found in sus-
this, a drop inlet structure in the corner of the
pension. All of the WP particles placed in suspen-
retention basin opposite the spoils inlet was
sion appeared to have settled in one hour or less.
designed. Decantation of the supernatant from the
Concentrations are indicative of dissolved WP.
basin is to be done over an adjustable weir
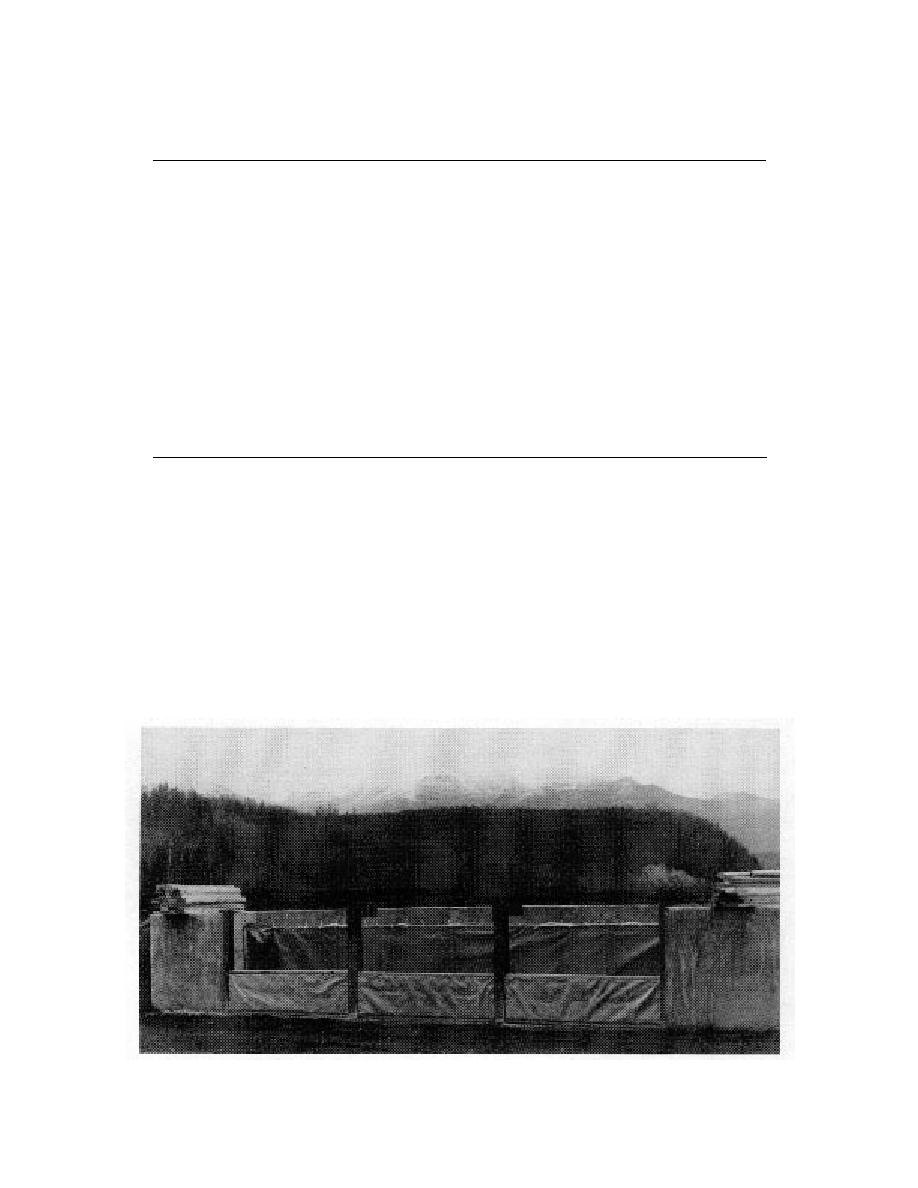
(Fig. 4).
Weir flow
The weir was modeled to ensure that the de-
After the sediment has settled sufficiently to en-
Figure 4. Drop inlet structure, showing adjustable weir.
8


 Previous Page
