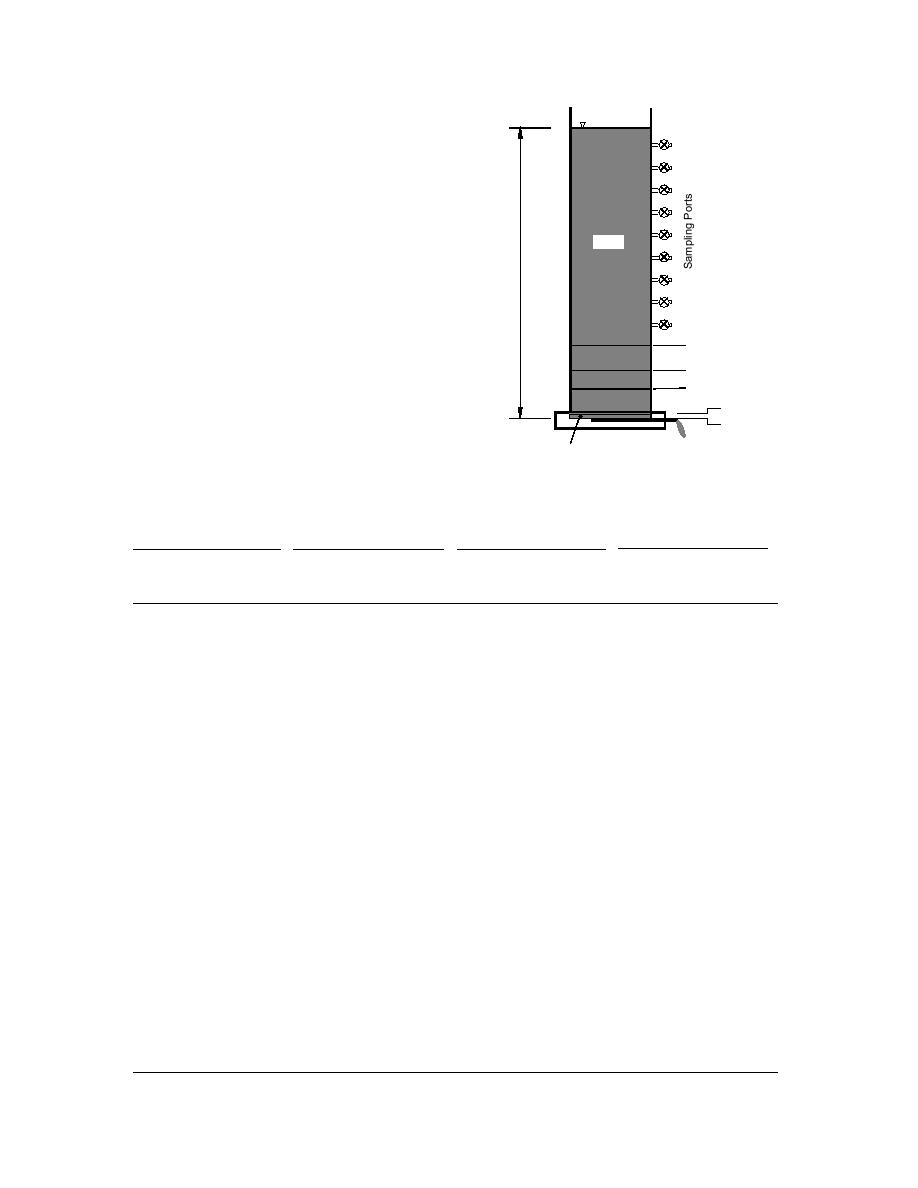
Water
h
Figure 2. Montgomery tube used for sed-
imentation tests.
Sludge
H sludge
Silt
H silt
Gravel
H gravel
H stone
Porous Stone
Table 2. Laboratory sedimentation test results following the Montgomery (1978) procedures.
Dose #1
Dose #1R
Dose #2
Dose #3
Elapsed
Interface
Percent
Elapsed
Interface
Percent
Elapsed
Interface
Percent
Elapsed
Interface
Percent
time
height
settled
time
height
settled
time
height
settled
time
height
settled
(min)
(cm)
(%)
(min)
(cm)
(%)
(min)
(cm)
(%)
(min)
(cm)
(%)
0
38.0
0.0
1
51.0
0.0
0
68.3
0.0
0
74.7
0.0
2
37.5
1.8
2
51.0
0.0
1
68.0
0.9
2
74.5
0.9
3
37.3
2.7
3
50.9
0.4
3
67.7
1.7
5
74.4
1.3
5
37.0
3.6
5
50.8
0.9
5
67.3
2.8
10
73.8
4.0
7
36.8
4.5
6
50.5
1.8
7
66.8
4.3
15
73.1
7.1
10
36.0
7.2
10
50.0
3.6
10
66.2
6.0
20
72.5
9.8
20
34.0
14.5
15
49.5
5.4
15
65.3
8.5
30
71.1
16.0
30
32.5
19.9
20
48.8
7.9
20
64.5
10.8
45
69.6
22.7
48
30.0
29.0
30
47.7
11.9
30
63.0
15.1
60
68.3
28.4
60
28.5
34.4
45
45.8
18.8
45
61.2
20.2
75
66.9
34.7
77
26.8
40.8
60
44.4
23.8
62
59.5
25.0
90
65.5
40.9
90
25.3
46.2
78
42.7
30.0
75
58.4
28.1
110
63.8
48.4
105
23.8
51.6
90
41.5
34.3
90
56.9
32.4
120
62.9
52.4
120
22.0
58.0
105
40.0
39.7
105
55.5
36.4
132
61.9
56.9
135
20.8
62.5
120
38.4
45.5
120
54.1
40.3
172
58.3
73.1
150
20.3
64.3
135
36.8
51.3
132
53.1
43.2
180
57.5
76.4
165
20.0
65.2
150
35.0
57.8
180
48.3
56.8
195
55.0
87.6
180
19.8
66.1
165
33.8
62.1
195
46.9
60.8
221
53.3
95.1
205
19.5
67.0
180
33.4
63.5
210
45.0
66.2
240
52.8
97.3
240
19.0
68.8
221
32.6
66.4
240
43.0
71.9
270
52.2
100.0
243
18.6
70.3
240
32.3
67.5
245
42.8
72.4
246
18.4
71.0
245
32.0
68.6
250
42.6
73.0
255
18.1
72.1
251
31.6
70.0
255
42.5
73.3
270
17.7
73.6
255
31.5
70.4
260
42.3
73.9
285
17.3
75.0
260
31.4
70.8
270
42.1
74.4
300
17.0
76.1
270
31.1
71.8
285
41.8
75.3
330
16.3
78.6
285
30.7
73.3
295
41.6
75.9
360
15.8
80.4
300
30.3
74.7
1380
33.1
100.0
390
15.5
81.5
315
30.0
75.8
1410
33.1
100.0
420
15.0
83.3
330
29.7
76.9
1380
10.4
100.0
360
29.1
79.1
1440
10.4
100.0
390
28.5
81.2
405
28.3
81.9
1380
23.3
100.0
6


 Previous Page
