Table 14. Applications to failure ( 1000) from simulations of
4480 kPa and the SCI was increased to
rigid test sections.
90. A comparison of the cumulative dam-
age with time for the case representing
RCON = 650
RCON = 500
RCON = 650
section ML5-R-5 with a 1.8-m (6-ft) wa-
Case
SCI = 80
SCI = 80
SCI = 90
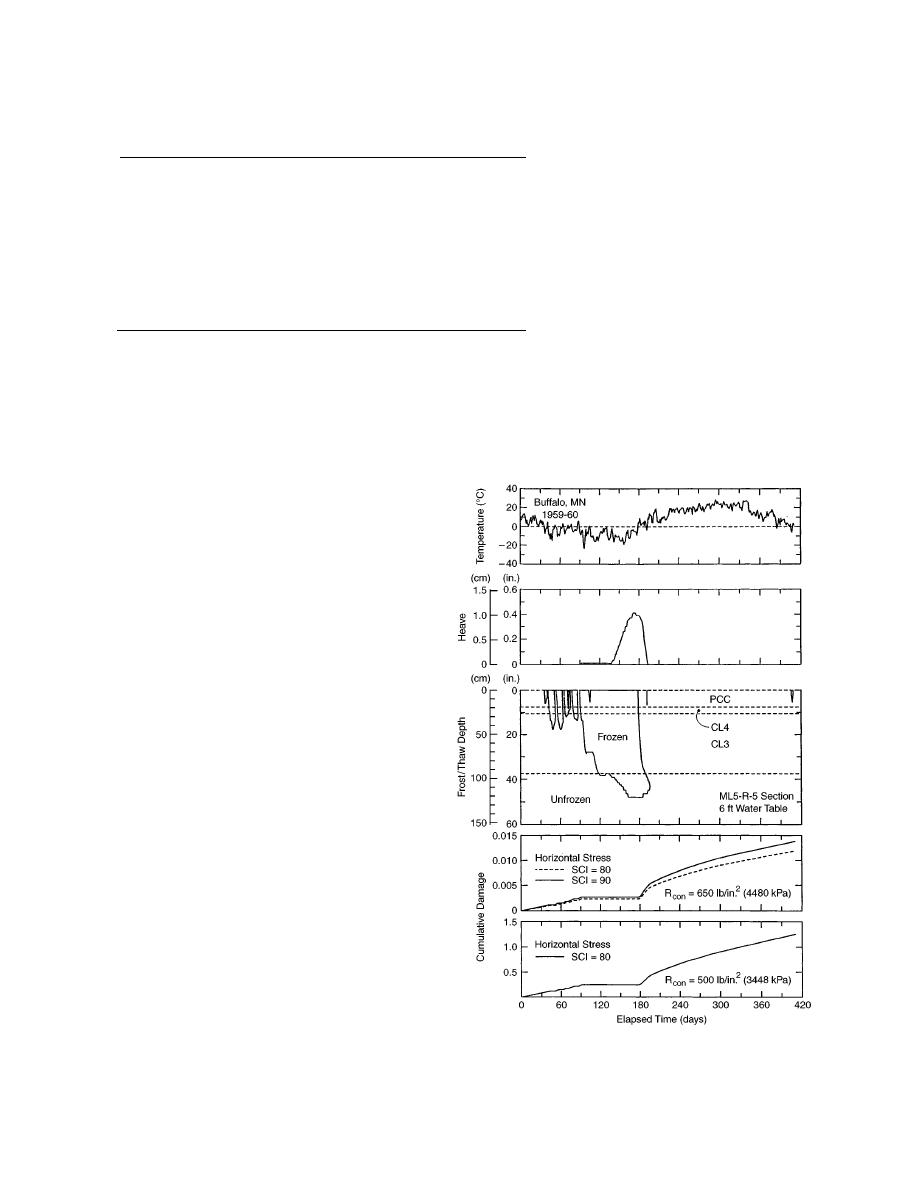
ter table (r5w6) using all three combina-
5-YEAR
tions of flexural strength and SCI is also
R5W6
52,601
507
45,244
illustrated in Figure 14. Appendix B has
R5W12
65,598
605
56,452
a compilation of graphs depicting the
frost/thaw penetration and cumulative
R6W4
157,655
1,505
135,622
R6W12
132,120
1,701
113,933
damage for all rigid sections simulated.
Cases with a flexural strength of 4480
10-YEAR
>5.6 108
>5.6 108
kPa exhibited very little damage, with
R11W6
18,761,000
>5.6 108
>5.6 108
the ML10-R-11 section having unmea-
R11W12
28,141,500
surable damage. Reducing the flexural
Notes:
strength to 3448 kPa greatly increased
RCON = Concrete flexural strength (lb/in.2)
the predicted damage for the 5-year sec-
SCI = Surface condition index at failure
tions, but had a lesser effect on damage
Traffic simulated at rate of 562,830 ESAL applications/yr.
in the 10-year section.
The pattern of damage accumulation
tern of damage accumulation from the Corps of
with time varied with the test section simulated
Engineers model is similar to the MS-1 model,
especially when the water table is shallow, caus-
ing larger resultant deflections and strains. For
simulations with deeper water tables, smaller
amounts of damage accumulate during the sum-
mer.
Damage from models using the vertical strain
criteria follow three general patterns: 1) a sharp
rise during spring thaw period with no accumula-
tion at other times of the year (e.g., Fig. 12), 2) a
series of increases during winter thaw events and
the spring thaw (Fig. 11), and 3) in the cases with
lower modulus subgrades, a gradual increase in
damage during the spring, with sharper increases
in the summer (Fig. 13). This last result is likely
due to the anomalously low asphalt moduli being
predicted by the Schmidt model.
Results--rigid sections
Predicted applications to failure for the con-
crete (rigid) sections is shown in Table 14, with
the three sections in the table indicating the re-
sults of a sensitivity study. In the left-hand sec-
tion, the flexural strength of the concrete was set
at 4480 kPa (650 lb/in.2) and the surface condi-
tion index (SCI) at the point of failure was set at
80. In the central section, the flexural strength
was reduced to 3448 kPa (500 lb/in.2), while the
SCI remained at 80. For predictions in the right-
Figure 14. Cumulative damage for case r5w6.
hand column, the flexural strength was kept at
24


 Previous Page
