exist in the field, resulting in less damage than
Table 11. Constants for equations to de-
termine gravimetric unfrozen moisture
would have been obtained with more reasonable
content, wug.
moduli.
The model numbers for the program NELAPAV
Equation constants*
(Table 4) were set as follows. Model 0, the linear
α
β
Soil
model, was used at all times for paving materials
and for soils in the frozen state. With model 0, the
Subgrade
1206
11.085
0.274
seed modulus is accepted as the modulus of the
1232
8.121
0.303
material layer. Model numbers were assigned to
unfrozen soils as follows: Model 1--class 6; Model
Class 3 special
3--class 3 and class 4; Model 4--both clay
stockpile
1.497
0.709
subgrades.
Class 4 special
In all of the cumulative damage studies on the
0.25†
Taxiway A
3.0
flexible pavements, it was assumed that the pave-
Class 5 special
ment properties were constant from one pavement
0.40†
Dense stone
2.0
test section to another. Some of the test sections
we simulated will have pavement properties dif-
Class 6 special
ferent from others because of the experimental
Stockpile
0.567
1.115
design of the paved surface. Some variations in
β
α T
the asphalt pavement properties could be consid-
*
wug, decimal form =
100 T0
ered in subsequent modeling efforts, but we main-
† Values
for these materials are estimated
tained the same asphalt pavement properties in all
of these simulations.
Results--flexible sections
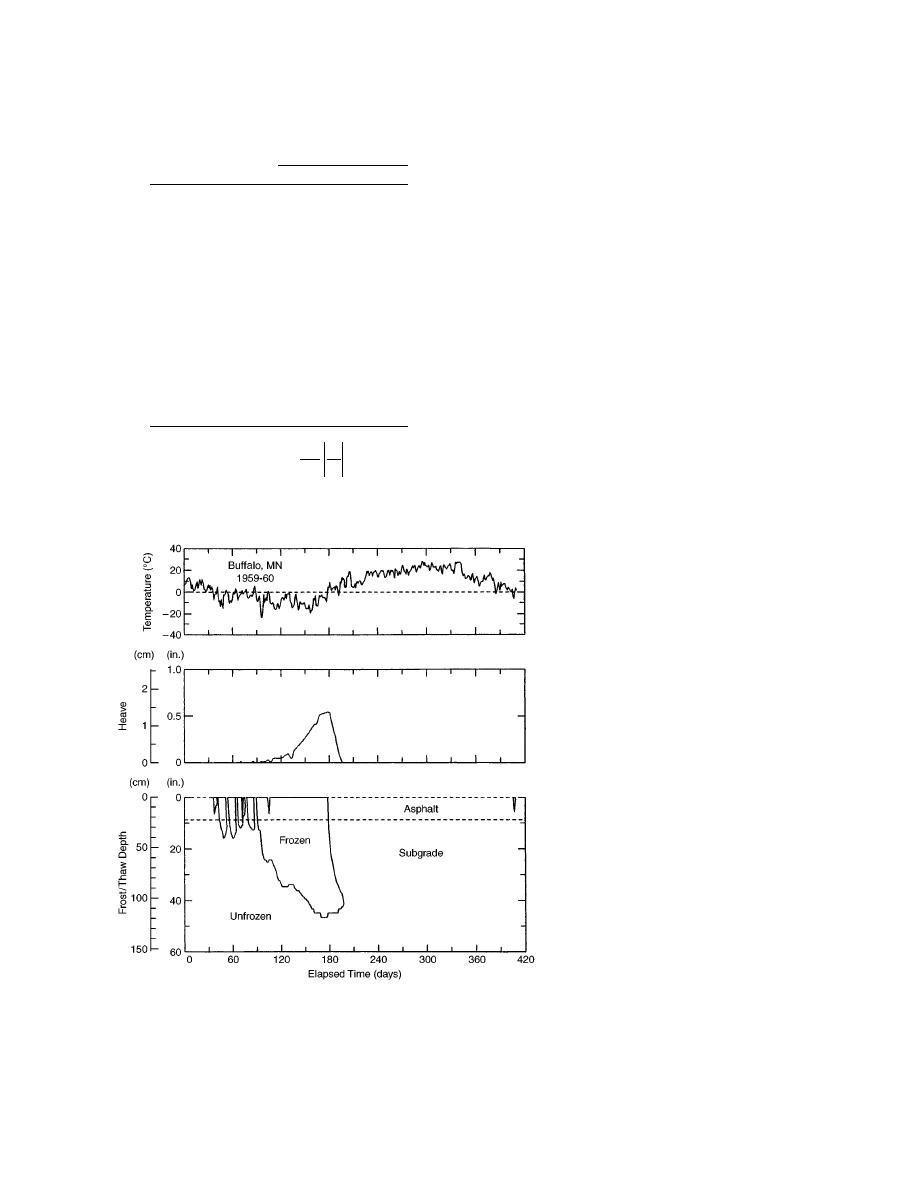
Output from FROST for the 5-year
full-depth simulation (f4w6) is shown
in Figure 8. The top graph shows the
daily mean air temperature for the pe-
riod from 1 October 1959 to 14 No-
vember 1960. The center portion il-
lustrates the predicted frost heave and
the bottom graph contains the pre-
dicted frost and thaw penetration as
functions of time. Frost output graphs
for all the flexible cases are compiled
in Appendix A. Table 12 contains
maximum frost heave and maximum
frost penetration depths for each of
the cases simulated (Table 8). Simu-
lations with shallower water table
depths had greater amounts of heave
and less frost penetration compared
to simulations with a deeper water
table location. Sections that included
the substitute for the class 4 special
subbase (taxiway A subbase) had
Figure 8. Example output from FROST for Mn/ROAD test sec-
higher amounts of heave than those
tion ML5-F4 with a 1.8-m (6-ft) water table. Simulation starts
with other combinations of subbase
on 1 October.
materials.
20


 Previous Page
