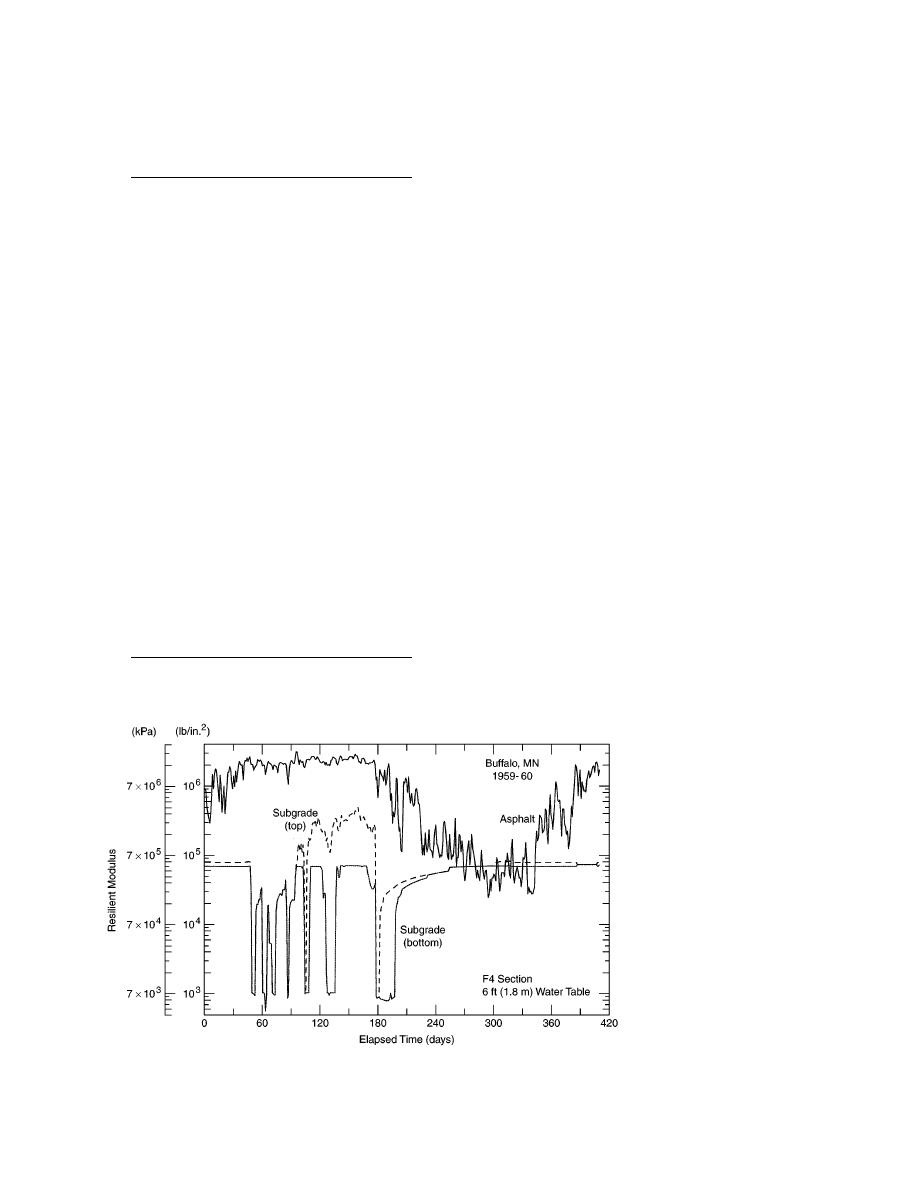
Figure 9 presents the moduli being calculated
Table 12. Maximum frost heave and frost
penetration in modeled simulations
by TRANSFORM and passed as seed moduli to
NELAPAV for the f4w6 case. The plotted moduli
Frost
Frost
are the minimum values for each day, with the
Cases
heave
penetration
subgrade (top) being located within 0.3 m (1 ft) of
cm (in.)
cm (in.)
the asphalt and subgrade (bottom) being the rest
5-YEAR
of the modeled section (to 4.0 m or 13.1 ft). Note
Flexible
that the predicted asphalt moduli during the sum-
f1w9
0.25 (0.10)
137.9 (54.3)
mer months are smaller than those of the subgrade,
f2w9
1.19 (0.47)
121.9 (48.0)
which results in high horizontal strains at the base
f2w20
0.33 (0.13)
142.0 (55.9)
of the asphalt layer during the summer months. In
f3w8
0.08 (0.03)
134.1 (52.8)
later simulations (Phase 2 and 3), we used other
f3w20
0.00
142.0 (55.9)
models to determine the asphalt modulus.
f4w6
1.37 (0.54)
118.1 (46.5)
f4w6 ld
1.32 (0.52)
118.1 (46.5)
Figure 10 shows the deflection and strains com-
f4w6 ss
0.03 (0.01)
137.9 (54.3)
puted by NELAPAV for the f4w6 case. The hori-
zontal strain at the base of the asphalt is low
Rigid
through the winter with a few small peaks during
r5w6
1.04 (0.41)
121.9 (48.0)
short-term thaw periods, then exhibits high peaks
r5w12
0.00
137.9 (54.3)
r6w4
4.72 (1.86)
103.9 (40.9)
during spring thaw and summer. It appears to be
r6w12
0.00
134.1 (52.8)
closely tied to the asphalt temperature/modulus
during the spring thaw. The vertical strain at the
10-YEAR
top of the subgrade is also low during the winter
Flexible
with three sharp peaks during thaw events. The
f14w50
0.00
134.1 (52.8)
f19w18
0.00
142.0 (55.9)
vertical strain also rises during spring and sum-
f21w18
0.00
134.1 (52.8)
mer, closely tracking the pavement surface tem-
f21w45
0.00
134.1 (52.8)
perature. The deflection plotted is from the base
f22w45
0.00
134.1 (52.8)
of the asphalt, but is assumed to be similar to the
surface deflection. It also shows peaks during mid-
Rigid
r11w6
1.42 (0.56)
118.1 (46.5)
winter thaws, and a maximum peak during the
r11w12
0.00
134.1 (52.8)
spring prior to drainage of excess moisture. Gen-
ld = low density (1.69 Mg/m3 or 105.5 lb/ ft3)
erally, deflections in the summer are greater than
winter values.
ss = second subgrade (1232)
Figure 9. Seed moduli
output by TRANSFORM
for Mn/ROAD test section
ML5-F4 with a 1.8-m (6-
ft) water table. Subgrade
(top) is within the upper
0.3 m (1 ft) of subgrade
beneath the asphalt. Sub-
grade (bottom) is beneath
that layer to the bottom
of the modeled section.
21


 Previous Page
