Table 16. Performance predictions for F3 test section with water table at 2.4
m (8 ft). Freeze/ thaw seasons applied as upper boundary temperatures were
mean year--195960, maximum year--197879, minimum year--198687,
average of the 3 coldest out of 30--196465.
Applications to failure ( 1000)
Failure criteria
Mean
Max
Min
3/30
Horizontal
Asphalt Institute (MS-1)
533
384
573
397
Asphalt Institute (MS-11)
1,224
1,215
1,117
1,445
Corps of Engineers
487
375
593
368
Coetzee/Conner
32,818
25,284
50,660
23,530
Vertical
>107
Asphalt Institute (MS-1)
96,046
51,120
96,046
>107
Corps of Engineers
1,197
600
1,143
>107
FAA
7,298
4,080
7,625
Note: Traffic simulated at rate of 562,830 ESAL applications/yr.
depth" section consisting of an asphalt layer lying
Table 16 lists the predicted damage in terms of
directly above the lean clay subgrade. The sec-
applications to failure from this environmental se-
ond, section F3, was a "conventional" section,
ries, in which traffic was simulated at 562,830
including class 6 special as the base material (sub-
ESALs per year. Compared with the mean year,
stituted for class 5 special in the actual pavement
failure due to the horizontal strain criteria (asphalt
structure) and class 3 special as the subbase.
cracking) is predicted earlier with the maximum
Physical properties used for the materials were
year and the 3/30 year, and later with the mini-
the same as shown in Table 13, with the exception
mum year. However, the spread of values is not
that a lower density (1.69 Mg/m3; 105.5 lb/ft3)
that great, and 3 of the 4 models predict failure
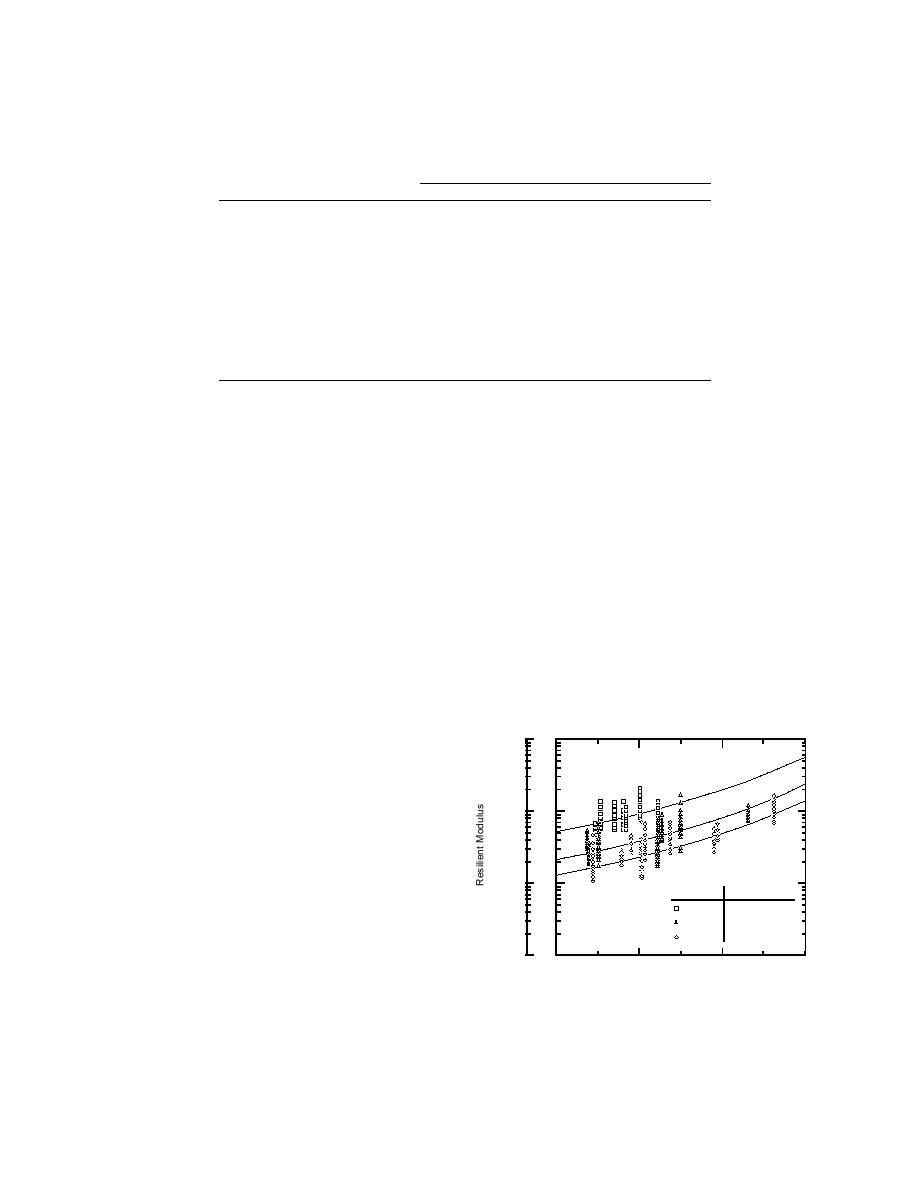
was used for the 1206 subgrade. Figure 16 illus-
sooner than the design figure of 3,300,000 appli-
trates predicted moduli for several densities of the
cations for all four of the seasons modeled. Time
1206 subgrade. The asphalt modulus was calcu-
of failure due to the vertical strain criteria (asphalt
rutting) is predicted sooner in the maximum year
than the mean year, and at about the same time
(lb/in.2 )
as the mean year with the 3/30 year. No damage
(kPa)
106
7 x 10 6
due to subgrade rutting was predicted with the
minimum year in which no frost penetrated the
115 lb/ft 3
subgrade.
5
105
108
7 x 10
Phase 3
105
The third phase of the study modeled two
flexible pavement sections to which 21 years of
4
104
environmental conditions were applied. Various
7 x 10
Density (lb/ft 3)
analyses were conducted attempting to correlate
High
114 - 117
the predicted damage with the characteristics of
Medium
107 - 110
104 - 106
Low
the freeze seasons simulated.
7 x 10 3
103
100
80
60
40
Degree of Saturation (%)
Cross sections/material properties
Figure 16. Resilient modulus vs. degree of satura-
The two cross sections simulated employed
tion of never-frozen 1206 subgrade material illus-
layer thicknesses from two Mn/ROAD test sec-
trating the effect of dry density.
tions (Table 7). The first, section F4, was a "full-
28


 Previous Page
