

16
main channel discharge and an indirect mea-
surement of flow over the roadway.
In contrast to this ice-jam event, the maxi-
mum open-water stage was 5.51 ft lower at
10.04 ft. This stage occurred on 29 March 1960,
12
with a reported discharge of 112,000 cfs. The
gage height was reported to be affected by back-
water, however, so although it is reported as an
open-water event, it may have been related to
Flood Stage
a downstream ice jam, which would also have
8
affected discharge calculations. The maximum
open-water stage of 10.04 ft was exceeded by
several other ice events in addition to the March
1978 event, including ice events that occurred
4
on 13 February 1952 (10.17 ft, ice jam reported
1950 `52
`55 `59
`61
`63
`71
`74
`77
`79
`82
`85
`88
downstream from gage); 20 February 1971
`51
`53
`58
`60
`62
`70 `72 `76
`78
`80
`83 `86
`89
(12.24 ft, ice jam at gage); 19 February 1972
Water Year
(10.19 ft, ice jam at gage); 18 January 1980 (10.44
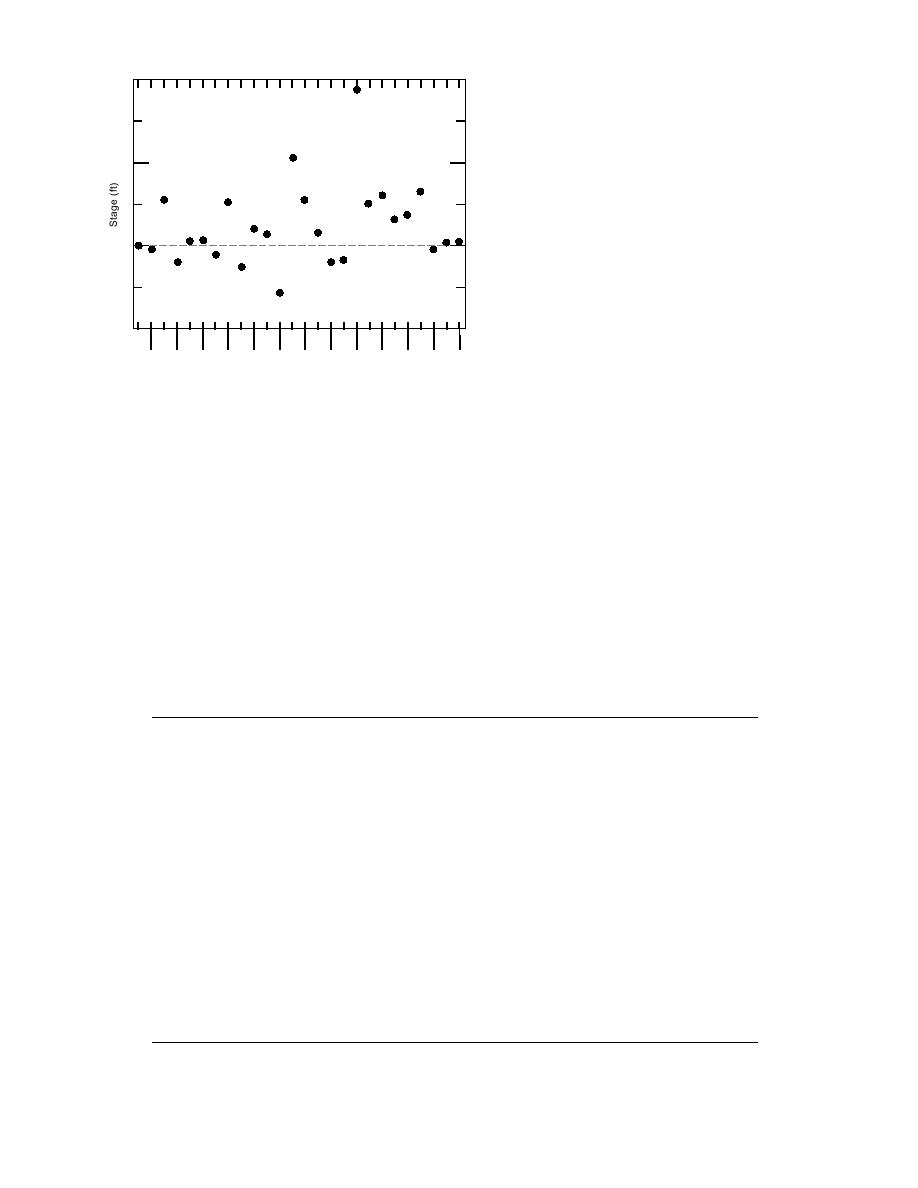
Figure 6. Ice-related peak annual stages at the USGS gage for
ft, ice jam downstream from gage); and 28 Feb-
the Platte River at North Bend for the period 1949 through
ruary 1985 (10.59 ft, ice jam downstream from
1992. Ice jams were reported in 1971, 1972 and 1978; all other
gage). During the 1980 event the Department
stages were affected by backwater from downstream conditions.
of Roads operated a crane equipped with a
wrecking ball from the Highway 79 bridge to
break ice in the jam. NWS records indicate that
an ice-jam event. This stage resulted in flooding
lowland flooding along the south bank resulted
along both sides of the river. The Omaha World-
from the 1985 event.
Herald reported that one person died in North
Ice jams formed about two miles west and one
Bend during this event and another was injured
mile east of the Highway 79 bridge at North Bend
when a basement wall caved in. Highway 79 was
on 13 March 1979. By 14 March the upstream jam
overtopped with water and ice. The average daily
discharge reported on this day was 54,000 cfs,
was located one-half to three-quarters of a mile
and the maximum instantaneous discharge was
upstream from the bridge. Backwater from this
calculated to be about 80,000 cfs, including the
jam eventually breached a dike along the south
Table 6. Summary of ice events at North Bend with a stage greater than the flood stage of 8 ft.
Date
Stage (ft)
Description
13 February 1952
10.17
ice jam at gage
29 March 1960
10.04
gage affected by backwater from ice
20 February 1971
12.24
ice jam at gage
29 February 1972
10.19
ice jam at gage
17 February 1974
8.6
gage affected by backwater from ice
19 March 1978
15.55
ice jam at gage, maximum gage height of record, one dead, many evacuated
14 March 1979
10.0
gage affected by backwater from ice, upstream jam flooded Hwy 79 and
Morse Bluff
18 January 1980
10.44
ice jam downstream from gage, lowland flooding reported, crane and wreck-
ing ball operated from bridge
22 February 1982
9.25
gage affected by backwater from ice, sandbagging of levee at McGinn's
Lake, Wolf Lake roads flooded
18 February 1983
9.49
gage affected by backwater from ice
28 February 1985
10.59
ice jam downstream from gage, lowland flooding south bank
24 February 1988
8.14
gage affected by backwater from ice
12 March 1989
8.19
gage affected by backwater from ice
8 March 1993
10.97
ice jams upstream and downstream from Hwy 79 bridge
11

 Previous Page
