lead to ice breakup. Precipitation amounts less
ice effects at the gage between 1944 and 1962.
than 0.05 inch were designated trace amounts.
This can be interpreted in several ways:
There actually were no ice events between
Summary of
1944 and 1962;
historical data collected
There were ice events but subsequent open-
A review of the historical records collected dur-
water events in the same year had higher
ing the initial phase of the study indicated that ice
stages than the ice events; or
events are relatively frequent on the Lower Platte,
The ice events that occurred were not re-
Loup and Elkhorn Rivers. Some locations have
ported or were reported as open-water events.
reported more ice-related damage than others, and
many of the locations are also subject to occasion-
Table 4. Maximum annual gage
al open-water flood damages. Records are good
heights associated with ice at the
USGS gage on the Loup River near
at some locations and sketchy at others. Histori-
Genoa (period of record 19441991,
cal data collected for the seven sites shown in
flood stage 9 ft).
Figure 1 are summarized below and discussed in
the section Analysis of Historical Data.
Ice-related annual
Date
maximum stage (ft)
Site 1. Loup River from
16 February 1962
10.0
Genoa to Columbus
18 December 1963
7.83
Several sites along the Loup River between
1 April 1965
10.33
19 March 1969
10.8
Genoa and Columbus have recurring ice-jam prob-
23 February 1970
8.59
lems. Unfortunately, little specific data are avail-
19 February 1971
10.37
able for jams which occur upstream from Colum-
28 February 1972
9.21
bus. Local residents and agency representatives
21 January 1973
8.36
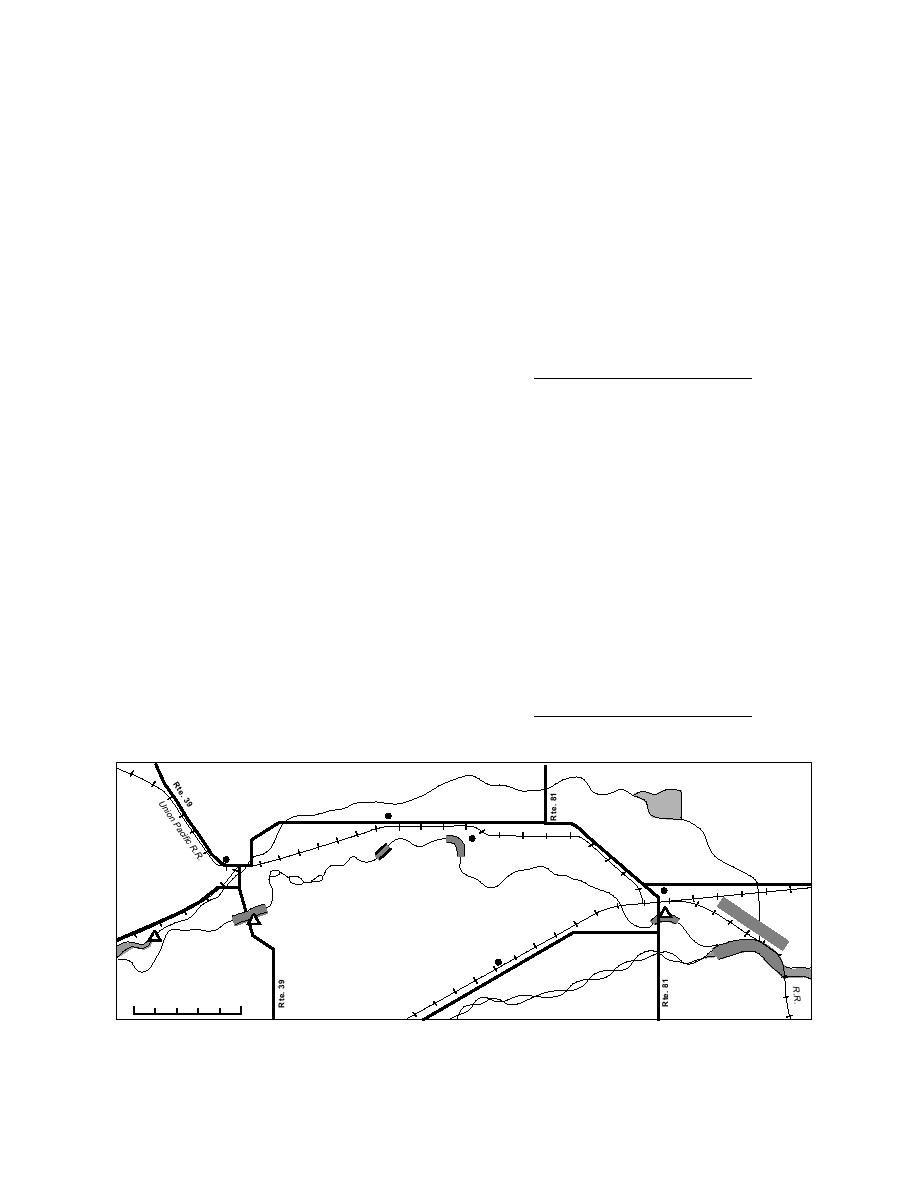
identified the sites shown in Figure 3.
15 February 1974
9.12
3 March 1975
8.36
The uppermost site is just downstream from
9 February 1976
8.79
the USGS gaging station on the Loup River near
23 February 1977
10.2
Genoa, which has operated continuously since
18 March 1978
12.12
1944. Although no detailed ice-jam information
15 March 1979
10.87
was reported at the site, the gaging station records
18 January 1980
10.79
30 December 1981
11.83
do confirm the presence of downstream ice jams,
21 February 1982
12.35
which can cause significant backwater effects at
17 February 1983
9.35
the gage. The maximum annual (water year) gage
27 February 1985
9.43
height for the station was caused by backwater
27 January 1986
10.14
from ice 22 times between 1962 and 1991, or about
24 February 1988
8.99
10 March 1989
9.4
73% of the time (Table 4). There were no reported
Canal
er
Riv
Lake
Loup
Babcock
Rte. 22
Monroe
.R.
fic R
Paci
n
Oconee
Unio
Genoa
Ice
Jams
up
R.
Columbus
Lo
Rte. 30
Bu
. 22
rlin
Rte
gto
.
R.R
USGS Gages
nN
c
cifi
ort
Pa
he
ion
rn
Un
30
R.
e.
Rt
Duncan
tte
Pla
0
5 miles
Figure 3. Identified recurring ice jam sites on the Loup River between Genoa and Columbus.
6


 Previous Page
