Ashland gage; the remainder of the flow was esti-
1978) and the Platte River at North Bend and Lou-
mated in the overbanks. The previous maximum
isville. Gaged sites outside of the study area on
discharge at the Ashland USGS gage was 107,000
the Elkhorn River are of value because of the
cfs on 12 June 1944.
Elkhorn River contribution to ice jamming prob-
lems near Ashland, one of the more frequent and
costly jam sites within the study. Data from the
Elkhorn River at Waterloo are also included in
ANALYSIS OF DATA
this preliminary analysis. The period included in
the historical analysis is 19501990.
Historical data
The available historical hydrological, meteoro-
Graphical analysis allows general characteriza-
logical and ice records presented previously were
tion of various combinations of ice event data.
examined to determine general characteristics or
Parameters examined in the analysis are shown
trends associated with ice events in the study area.
in Table 10. Discharge at each gage can be com-
pared by normalizing it as runoff per square mile
Since it is difficult to quantify ice event occur-
rence at sites which are not gaged, the historical
of contributing drainage area. Stages at different
analysis concentrates on gaged sites within the
locations are more difficult to compare because
they are a result of site-specific conditions such as
study area. These sites include the Loup River
jam conformation, cross-sectional shape, width,
near Genoa, the Loup River at Columbus (until
water slope and presence or absence of levees. As
a result, ice and discharge conditions that might
2
cause ice-related flooding at one location may not
cause flooding at another. However, stage is still a
valuable tool in comparing the severity of jam-
ming at one locations vs. another. Therefore, we
have chosen to normalize stage at different loca-
tions by the reported flood stage for each loca-
1
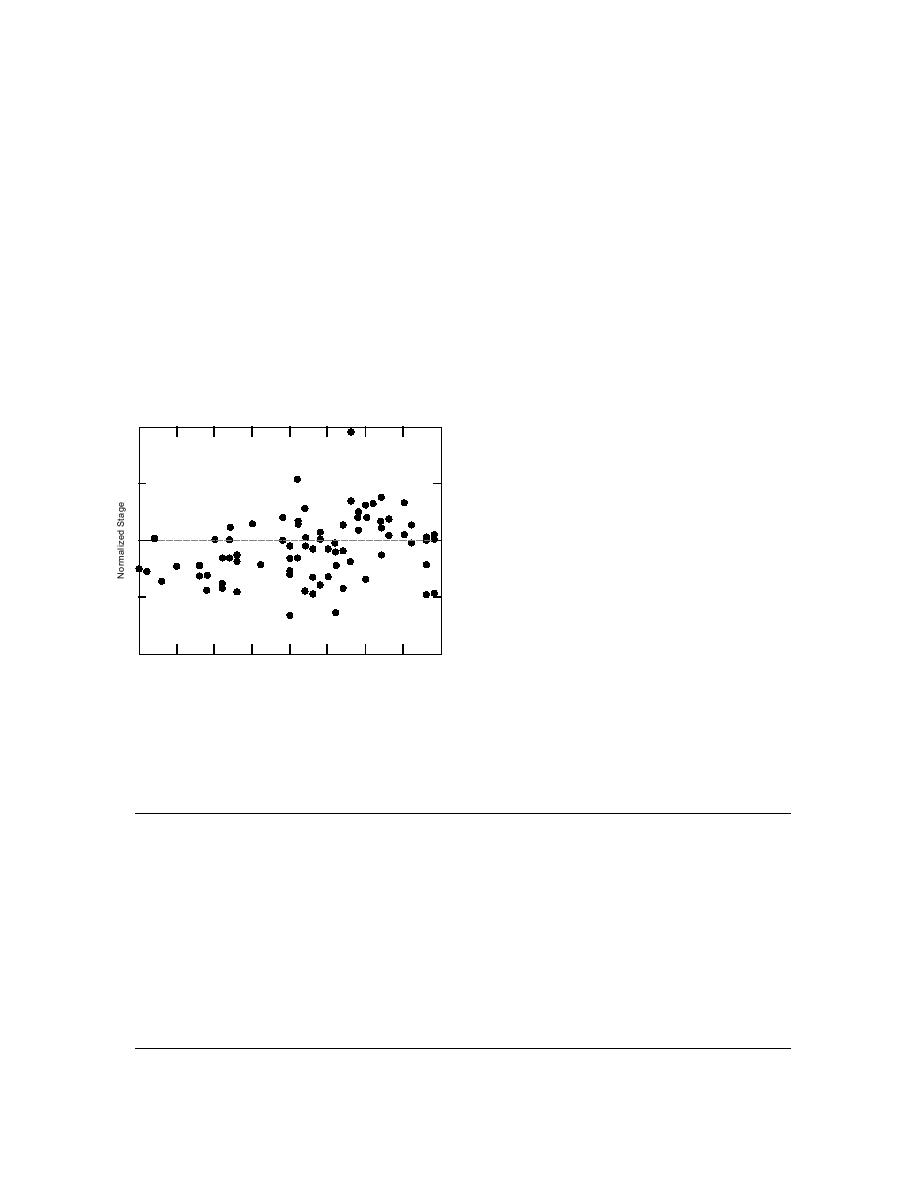
tion. The normalized stage, which is the maxi-
mum stage divided by the flood stage, is shown
in Figure 7 for each water year between 1950 and
1990. A normalized stage of 1.0 is at flood stage,
and normalized stages greater than 1.0 are above
flood stage. Table 11 lists the ice events for which
0
the normalized stage is greater than 1.0.
1950
`55
`60
`65
`70
`75
`80
`85
`90
Water Year
Figure 7 shows that about 44% of the known
Figure 7. Normalized stage for ice events between
ice events that occurred during the period 1950
1950 and 1990 for the gages in the study area plus the
1990 resulted in water levels greater than flood
Elkhorn River at Waterloo.
stage at Genoa, Columbus, North Bend and Lou-
Table 10. Parameters used in characterization of ice events in the Lower Platte River basin study area.
Parameter
Abbreviation
Definition
Maximum stage
max stage
recorded ice-affected stage (ft), generally a maximum annual
gage height either due to an ice jam or to backwater from down-
stream ice jams
Julian Day of maximum stage
JD max stage
the date when the maximum stage occurred, in Julian Days,
where day 1 = 1 October, the start of the water year
Flood stage
flood stage
reported flood stage (ft)
Normalized maximum stage
normalized stage
ratio of maximum stage to flood stage
Maximum discharge
max Q
recorded maximum average daily discharge (cfs) between 1 Jan-
uary and 31 March
Julian Day of maximum Q
JD max Q
the Julian Day when the maximum discharge occurred
Maximum AFDD
max AFDD
the maximum absolute value of the accumulated freezing de-
gree-days since the start of cold
Julian Day of maximum AFDD
JD max AFDD
the Julian Day when the maximum AFDD was reached
16


 Previous Page
