Table 15. Concentrations (g/g) of Ag, Cd, Sn, Sb, and Ba
1.0
determined by fundamental parameter analysis using the
Spectrace 9000.
0.8
Metal concentrations (g/g)
Material & spike
Ag
Cd
Sn
Sb
Ba
K
Ottawa sand
0.6
1000 ppm
937
1110
1000
915
772
500 ppm
504
581
429
474
353
250 ppm
274
394
269
196
174
125 ppm
193
229
174
109
75
0.4
0 ppm
77
111
43
ND
ND
Matrix
25
74
41
ND
ND
L
Ft. Edwards clay
0.2
1000 ppm
820
976
857
654
601*
500 ppm
377
542
452
345
300*
250 ppm
197
361
226
261
215*
125 ppm
86
172
154
108
148*
0
20
40
60
80
100
0 ppm
ND
127
74
ND
379
Atomic Number
Matrix
ND
100
81
17
436
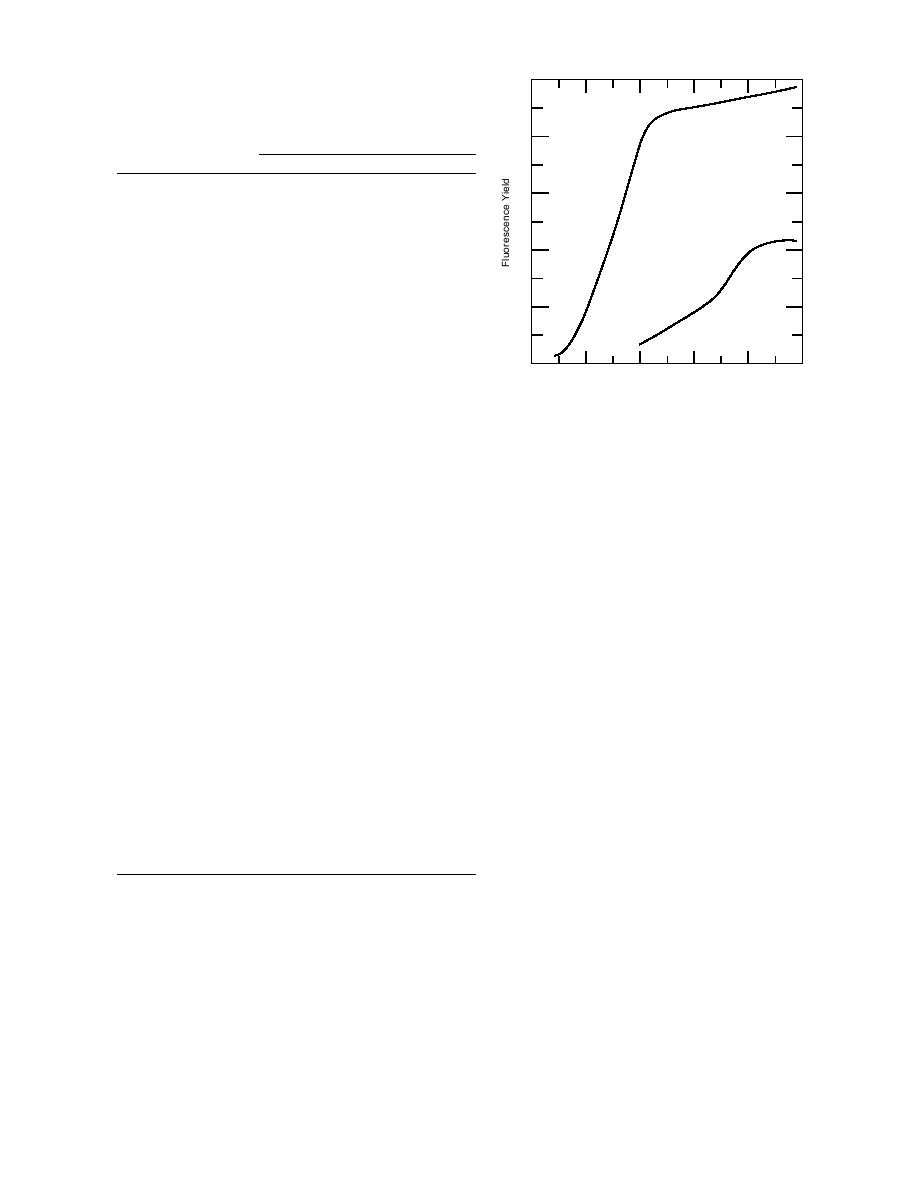
Figure 4. Fluorescence yield vs. atomic number for
K and L lines.
CRREL soil
1000 ppm
998
1060
1050
955
715*
500 ppm
508
584
527
490
381*
even at this level can be greater than 50% from
250 ppm
268
302
301
276
201*
the true concentration when analyzing a vari-
125 ppm
191
225
153
122
92*
ety of soils. Most likely, the bias in the deter-
0 ppm
67
51
37
16
288
mined concentrations is the result of a matrix
Matrix
40
99
28
ND
329
effect, while the extent of uncertainty is a func-
Rocky Mountain Arsenal
tion of both the matrix effect and the character-
1000 ppm
1060
1200
1040
1010
850*
istic analyte response.
500 ppm
535
613
486
562
472*
In summary, these two methods of rapid sample
250 ppm
296
406
336
221
250*
125 ppm
190
253
194
133
105*
analysis with field-portable XRF systems often
0 ppm
77
143
33
22
716
achieved the data requirement for screening of
Matrix
37
80
58
14
734
50% accuracy at and below a concentration of
1000 g/g. This goal was accomplished for a
Tampa Bay sediments
1000 ppm
989
1141
1030
897
706
variety of soil matrices, and the results in Tables
500 ppm
486
557
485
445
365
79 show that this approach is also promising
250 ppm
268
299
205
235
215
for several other particulate matrices (e.g., sedi-
125 ppm
181
189
114
115
92
ment, dust, paint chips, and sludge). The deter-
0 ppm
56
42
51
ND
ND
Matrix
56
84
55
12
ND
mination of Ni, Co, and Cr, however, was not
found to accomplish this goal consistently, even
Lebanon landfill soil
though reported estimates of detection for XRF
1000 ppm
914
1190
1020
930
832*
analysis are well below 1000 g/g. It appears
500 ppm
525
608
538
515
343*
250 ppm
301
337
287
259
232*
that for analytes with poor XRF sensitivity, ma-
125 ppm
205
223
165
133
111*
trix effects are more problematic, and matrix-
0 ppm
39
66
41
ND
278
specific standards would be necessary to
Matrix
ND
18
71
18
300
achieve a 50% accuracy.
* Average of 0 ppm and matrix subsamples subtracted
CONCLUSIONS
fects, matrix composition and characteristic analyte
response, Figure 5 shows the average concentra-
tion and standard deviations for the 1000 g metal/
With the exception of Ni, Co, and Cr, the deter-
mination of Cu, Zn, As, Pb, Hg, Tl, Se, Ag, Cd, Sn,
g spiked soil matrices. Overall, both the precision
Sb, and Ba at and below 1000 g/g in a variety of
and accuracy of analysis improves with atomic
solid particulate materials was often within 50%
number. However, for Cr, Co, and Ni, the degree
of the expected values when using either funda-
of bias and range of uncertainty shows that values
11


 Previous Page
