Table 9. Concentrations (g/g) of Cu, Zn,
1200
and Pb determined for field soil samples.
--
Lead
O ------------------
Metal concentrations (g/g)
F ttawa Sand
1000
Ct. Edwards Clay
Field samples
Cu
Zn
Pb
RRREL Silty/Sand
T ocky Mt. Arsenal
A
114**
1140**
253**
800
Lampa Bay Sediments
[176]
[1260]
[229]
ebanon Landfill
286*
1500*
318*
600
B
776**
1390**
488**
[756]
[1310]
[473]
984*
1810*
614*
400
C
1860**
261**
2060**
[1750]
[182]
[1650]
1600*
220*
1600*
200
D
3960**
735**
546**
[3270]
[408]
[475]
0
3510*
688*
494*
0
200
400
600
800
1000
Treatment Level (g / g)
E
449**
1260**
350**
[443]
[1230]
[328]
1200
567*
1710*
416*
Lead
Ottawa Sand
F
104**
182**
87**
Ft. Edwards Clay
[145]
[200]
[108]
CRREL Silty/Sand
331*
391*
245*
Rocky Mt. Arsenal
Tampa Bay Sediments
800
**
Concentrations based on acid-extraction/
Lebanon Landfill
ICP analysis
[ ] Concentration estimate based on response
factor/Compton Kα peak normalization
with X-Met 920
* Concentration estimate based on funda-
400
mental parameter analysis with X-Met 920
This study of laboratory-spiked soils was in-
cluded because commercial reference materials
typically contain only a few metals (e.g., Cu, Zn,
0
400
800
1200
Pb) at concentrations that can be readily detected
Treatment Level ( g/g)
by XRF analysis. The soil spiking method used
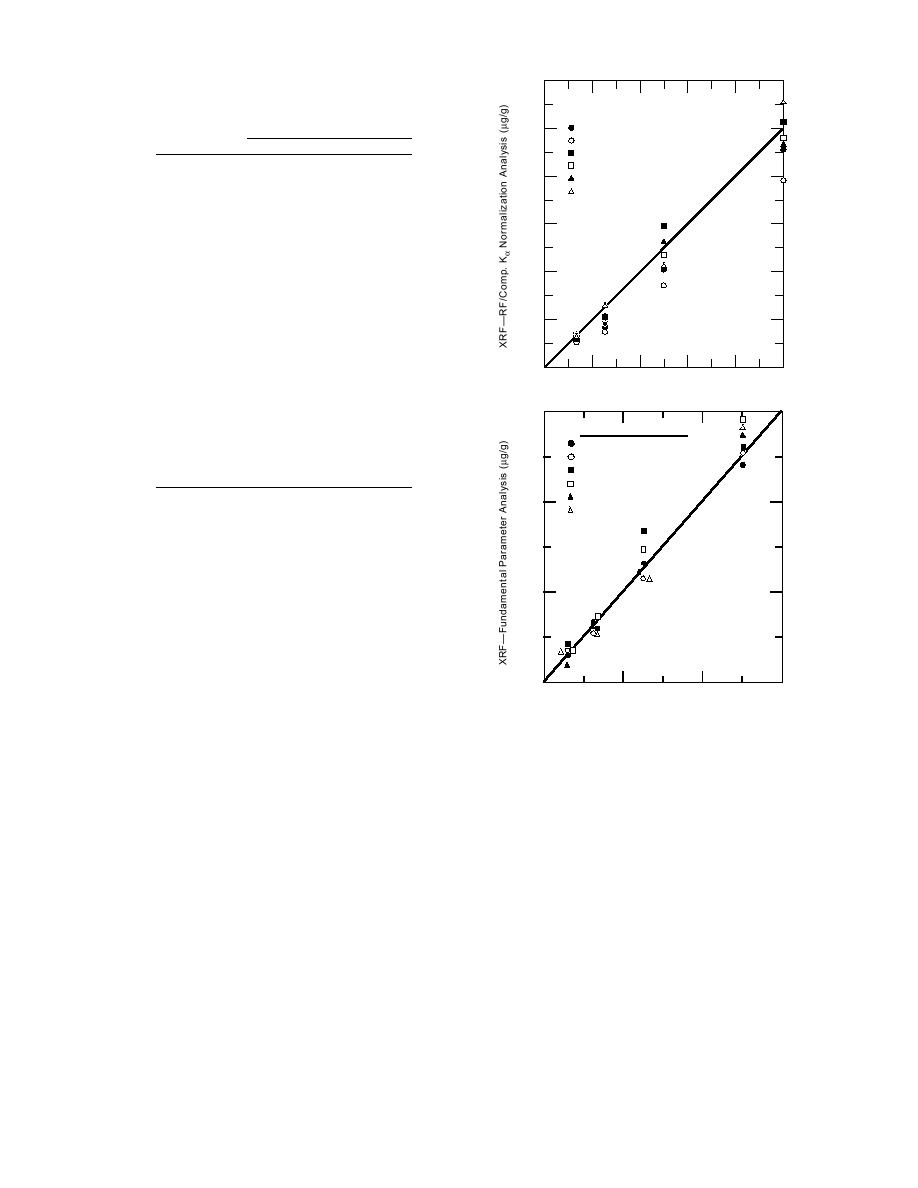
Figure 2. Lead concentrations (g/g) established
(Hewitt 1994b) appears to have resulted in fairly
for spiked soils by both RF/Comp. Kα normaliza-
homogenous and accurate analyte concentrations,
tion and FP analysis.
as shown by Figures 2 and 3. Plots of the results of
Pb and Sb were chosen to show this feature be-
cause XRF analysis is particularly sensitive for
Spectrace 9000, were most likely caused by a peak
these two metals (Table 6), and they are represen-
overlap with Tl. This problem occurred because
tative of metals excited by the Cd-109 and Am-241
Tl had not been one of the metals included in the
primary sources, respectively. It is logical to as-
FP software. With the exception of a few values
sume that the other metals spiked onto the differ-
established for the two lowest treatment levels for
ent soil matrices were likewise evenly distributed.
As and Cd (and Tl by RF/Comp. Kα) these metals
were also within the 50% concentration criterion.
The results in Tables 1015 show that these two
methods of rapid sample analysis consistently es-
Clearly, the concentrations of all of these metals
can be adequately estimated at 1000 g/g and be-
tablished concentrations for Cu, Zn, Pb, Se, Ag,
Sn, Sb, and Ba that were within 50% of the ex-
low by these two rapid methods of XRF analysis.
pected values from 1000 to 125 ppm. This was also
Furthermore, since both methods established con-
the case for Hg as determined by RF/Comp. Kα
centration trends that were consistent with the
normalization analysis. The few aberrant values
treatment levels, they would correctly define the
for Hg, as established by FP analysis with the
areas of greatest concern.
7


 Previous Page
