Table 10. Concentrations (g/g) of Cr, Cu, Zn, As, and Pb
1200
determined for spiked soil matrices by response factor/
Antimony
Compton Kα peak normalization.
Ottawa Sand
Ft. Edwards Clay
CRREL Silty/Sand
Metal concentrations (g/g)
Rocky Mt. Arsenal
Material & spike
Cu
Zn
As
Pb
Cr
800
Tampa Bay Sediments
Lebanon Land fFlilll
nd i
Ottawa sand
1000 ppm
1010*
1020
1420
911
1770
500 ppm
534*
458
381
411
856
250 ppm
264*
224
324
182
312
125 ppm
132*
127
72
139
84
400
0 ppm
69
ND
ND
ND
ND
Matrix
64
18
ND
10
ND
Ft. Edwards clay
1000 ppm
711*
751*
906
785
979
500 ppm
289*
374*
491
344
638
250 ppm
144*
252*
229
150
175
0
400
800
1200
1200
Treatment Level (g/g)
125 ppm
142*
91*
104
108
304
0 ppm
199
81
ND
19
46
Antimony
Matrix
218
80
ND
4
ND
Ottawa Sand
Ft. Edwards Clay
CRREL soil
CRREL Silty/Sand
Rocky Mt. Arsenal
1000 ppm
787*
870
782
1030
1100
800
Tampa Bay Sediments
500 ppm
461*
541
635
597
439
Lebanon Land filill
LandF
250 ppm
250*
247
320
178
220
125 ppm
69*
152
26
130
250
0 ppm
86
48
48
ND
93
Matrix
62
59
ND
18
257
400
Rocky Mountain Arsenal
1000 ppm
897*
1050
1450
960
1160
500 ppm
483*
459
608
470
493
250 ppm
209*
245
304
211
349
125 ppm
93*
153
105
125
229
0 ppm
76
ND
37
ND
205
0
Matrix
62
2
41
23
ND
400
800
1200
Treatment Level (g/g)
Tampa Bay sediments
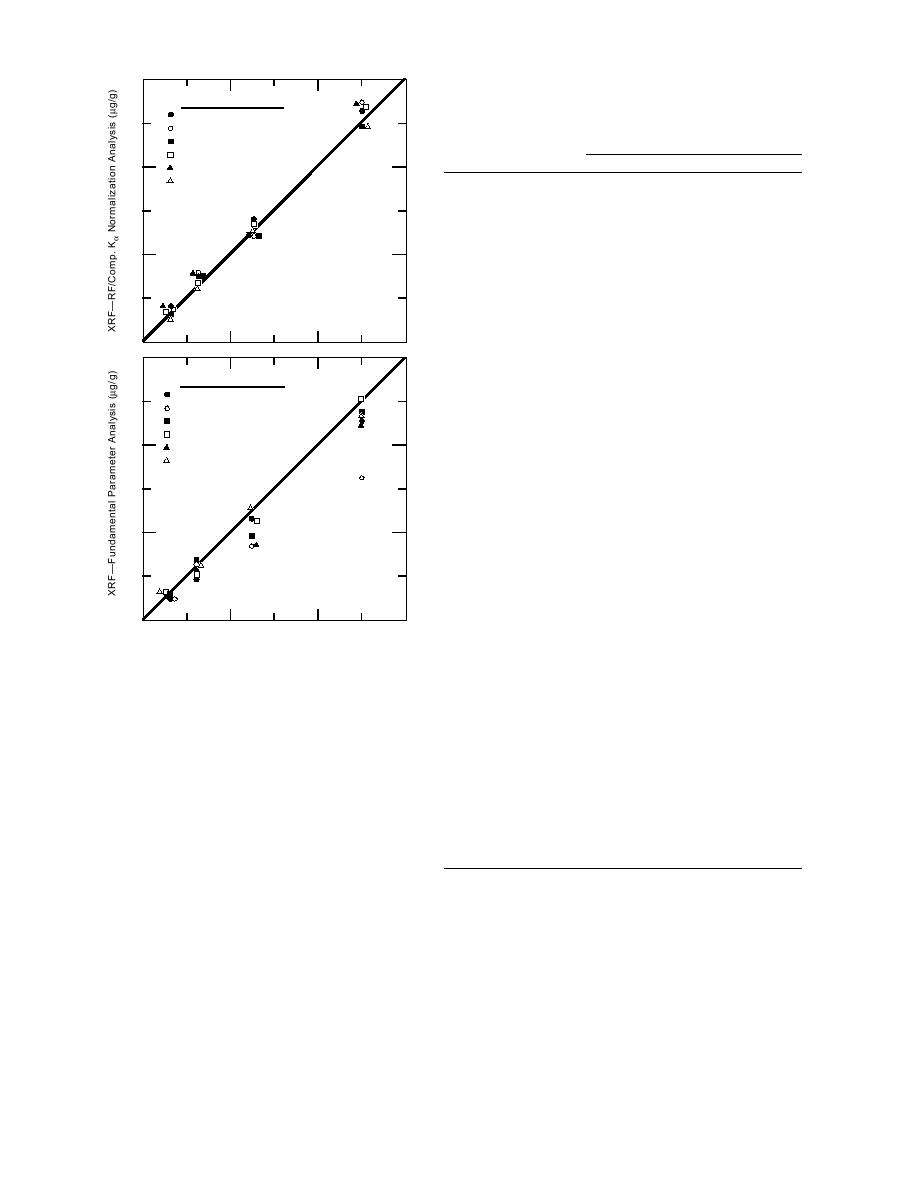
Figure 3. Antimony concentrations (g/g) estab-
1000 ppm
842*
939
1350*
936
1570
lished for spiked soils by both RF/Comp. Kα normal-
500 ppm
513*
486
560*
526
653
ization and FP analysis.
250 ppm
250*
218
200*
219
639
125 ppm
103*
159
73*
124
219
0 ppm
60
11
220
7
120
Matrix
71
ND
249
ND
99
The remaining metals in this study, Ni, Co,
and Cr, required additional qualifications be-
Lebanon landfill soil
1000 ppm
859*
872
988
1192
1500
cause their estimates of detection precluded
500 ppm
373*
469
536
423
495
some of the lower laboratory treatment levels.
250 ppm
195*
224
305
264
407
For instance, Ni and Co could only be assessed
125 ppm
94*
140
78
135
326
for spiked concentrations that were >205 ppm
0 ppm
99
2
ND
ND
ND
(g/g), likewise Cr for concentrations >525 ppm
Matrix
70
8
ND
24
ND
and >270 ppm for FP and the RF/Comp. Kα
* Average of 0 ppm and matrix subsamples subtracted
analysis, respectively. Values for all three of
these metals were established by both methods of
analysis that failed to meet the 50% concentra-
ods of analysis tended to establish high estimates
tion criterion. High concentration estimates tended
for Cr for soil matrices with low Fe content. Even
to be established for both Ni and Co by FP analy-
though this apparent matrix effect was not ad-
sis in soils with low Fe content (Table 14). In con-
equately handled by either of these two methods
of analysis to meet the 50% criterion consistently,
trast, low concentrations of these two metals were
established by RF/Comp. Kα normalization analy-
the appropriate concentration trends were estab-
sis when high levels of Fe were present. Both meth-
lished.
8


 Previous Page
