Yuma Total Solar
1200
y = 1.0656x
2
R = 0.9515
1000
800
600
400
200
0
0
200
400
600
800
1000
1200
Measured Solar Flux(W/m2)
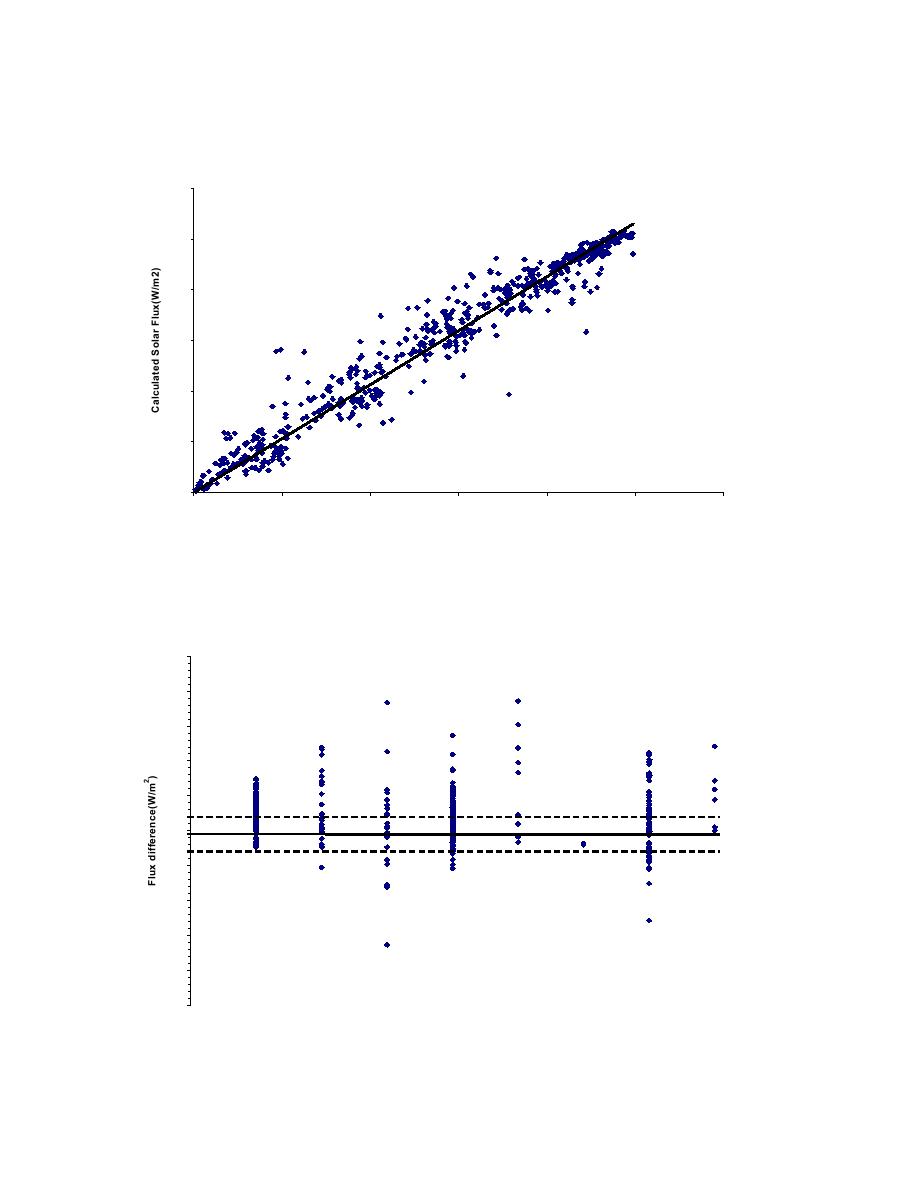
Figure 2.6 Scatter diagram of the total solar measured and calculated flux and the least
square fit to the data.
Calculated Minus the Measured Total Solar Flux
for Different Cloud Conditions
500
400
300
200
100
0
0
1
2
3
4
5
6
7
8
9
-100
clear
low
low
low
+
+
+
Low
high
middle
high
middle
-200
+
high
-300
middle
+
middle
-400
high
-500
Figure 2.7 Calculated minus the measured total solar flux for different cloud conditions
for Yuma. The dashed lines are 50 W/m2.
12


 Previous Page
