C a lc u la te d M in u s th e M e a s u r e d T o ta l S o la r F lu x
fo r D iffe r e n t C lo u d C o n d itio n s
500
lo w
+
400
h ig h
300
200
100
0
c le a r
m id d le
-1 0 0
lo w
+
m id d le
h ig h
+
h ig h
lo w
-2 0 0
m id d le
+
+
m id d le
h ig h
Low
-3 0 0
-4 0 0
-5 0 0
0
1
2
3
4
5
6
7
8
9
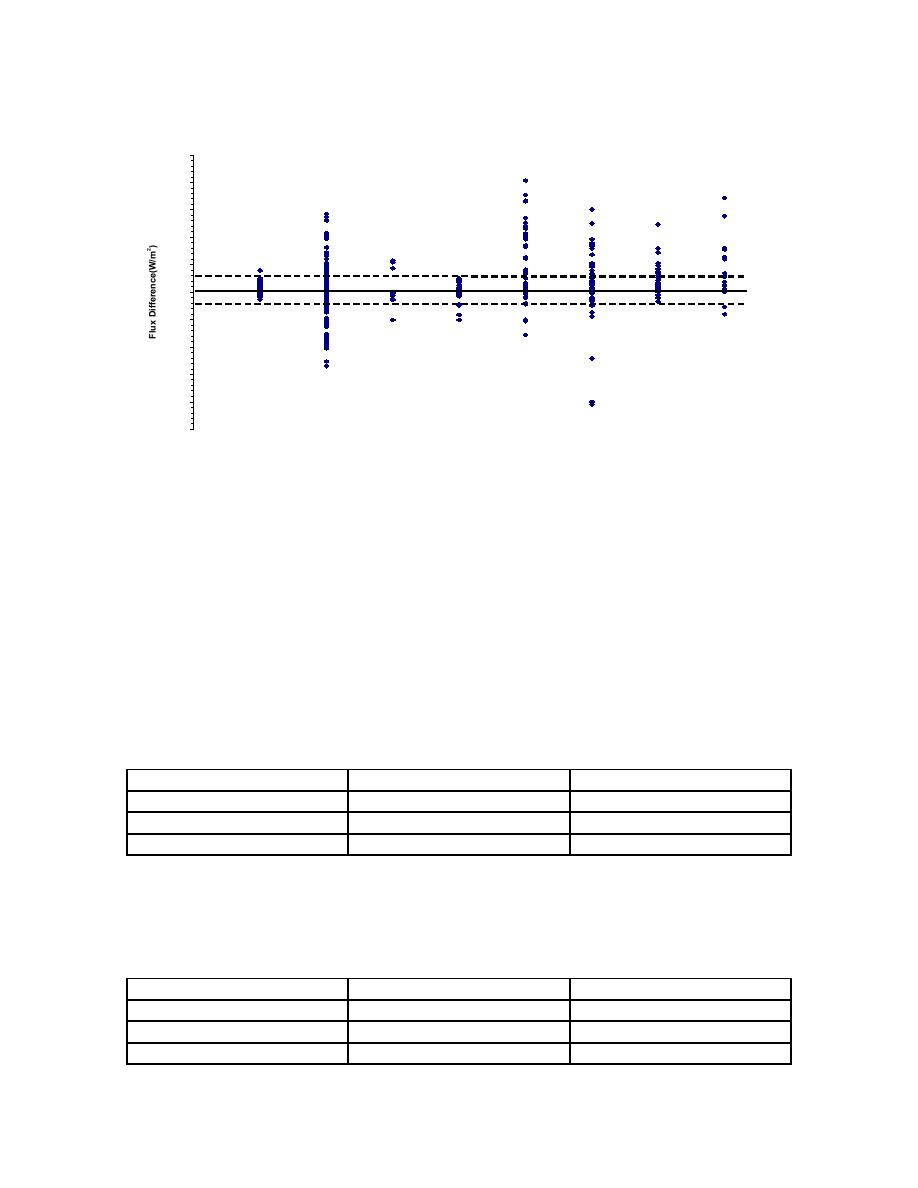
Figure 2.5 Calculated minus the measured total solar flux for different cloud conditions
for Grayling I. The dashed lines are 50 W/m2.
The analysis of the Yuma data indicates less scatter (Figure 2.6). This is anticipated,
since there are fewer observations with clouds. Again, the correlation coefficient (Table
2.6.2) is lowest for the diffuse component of the solar flux. In general, the model
performs better in the low cloud amount environment associated with the meteorological
conditions at Yuma. The flux difference as a function of cloud conditions (Figure 2.7)
again indicates that the model fluxes tend to be greater than the measured fluxes, even for
clear conditions. Yuma is a very dry environment and a dust layer frequently developed
by the end of the day as a result of the military traffic in the local training area. The
model does not have a provision for handling the reduction of solar flux at the surface
due to a dust layer.
Table 2.6.2 Equation of fit (forced through the origin) and correlation coefficient for Yuma.
R2
Solar Flux
Equation of Fit
Total
y=1.0656x
0.9515
Direct
y=1.0706x
0.9023
Diffuse
y=0.9708x
0.6191
The analysis for Grayling II is presented in Figures 2.8 and 2.9 and Table 2.6.3. As with
Grayling I, the correlation coefficients for the total, direct, and diffuse solar flux are less
than the values for the Yuma analysis.
Table 2.6.3 Equation of fit (forced through the origin) and correlation coefficient for Grayling II.
R2
Solar Flux
Equation of Fit
Total
y=1.0395x
0.8363
Direct
y=0.98x
0.8266
Diffuse
y=1.1477x
0.5471
11


 Previous Page
