T i m e iS ee iSeroestofetheifDu s e tM e a s u red & CCla lulutedeSoSao lFlr x l u x
T m r e s i f h D f irec M easur e d & a c c a la t d l r a uF
800
Measured Total Solar
700
Calculated Total Solar
M e a s u re d D iffus e S o la r
C a lc u la te d D iffu s e S o la r
600
500
400
300
200
100
0
267
268
269
270
271
272
273
274
275
276
277
Fractional DOY
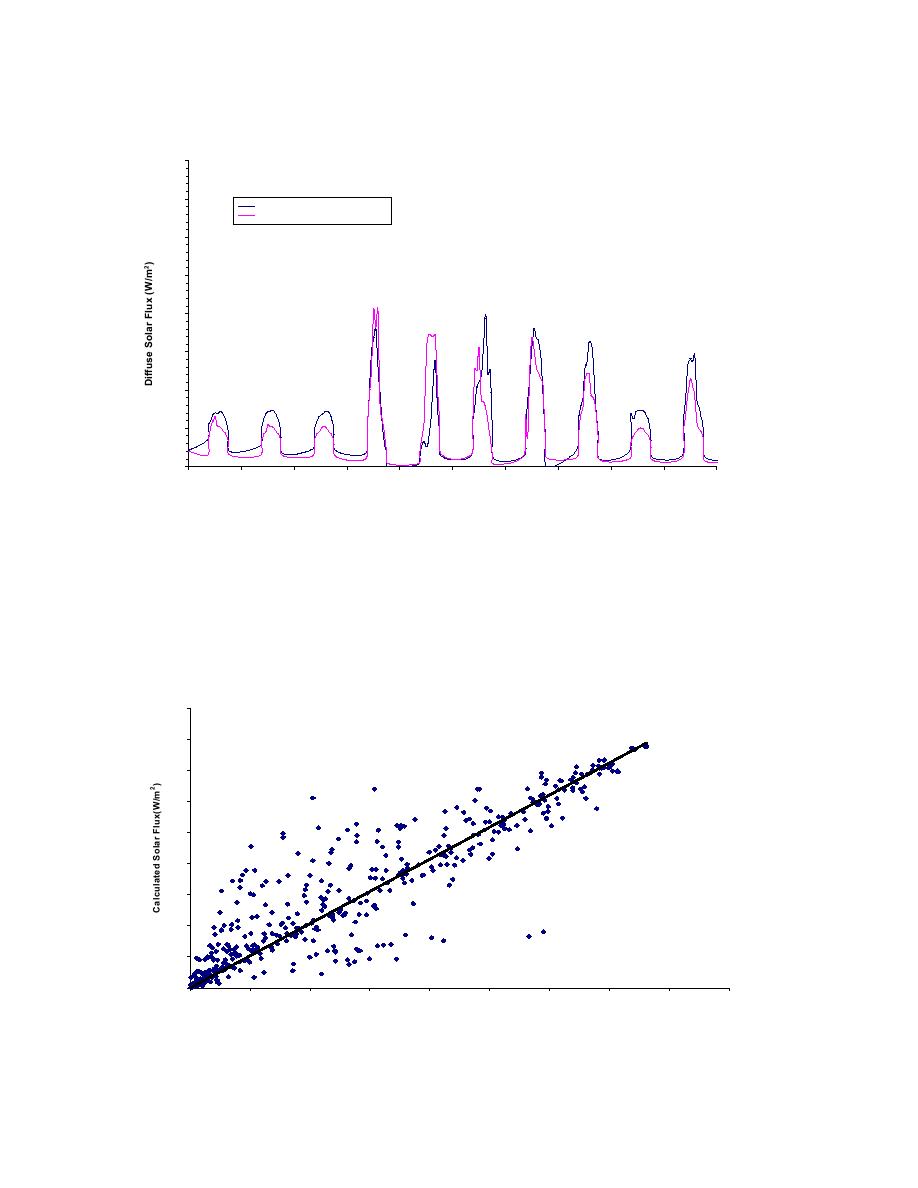
Figure 2.3 Same as Figure 2.1 but for the diffuse solar flux.
Most surface energy budget models, including FASST, utilize only the total solar flux.
Figure 2.4 is a scatter diagram of the total measured and calculated solar flux. A least
square fit to the data and its correlation coefficient, R2, is presented in the figure. The
least square fit has been forced through the origin (0,0).
Grayling I Total Solar Flux
900
y = 1.0361x
2
800
R = 0.8049
700
600
500
400
300
200
100
0
0
100
200
300
400
500
600
700
800
900
2
Messured Solar Flux(W/m )
Figure 2.4 Scatter diagram of the total solar measured and calculated flux and the least
square fit to the data.
9


 Previous Page
