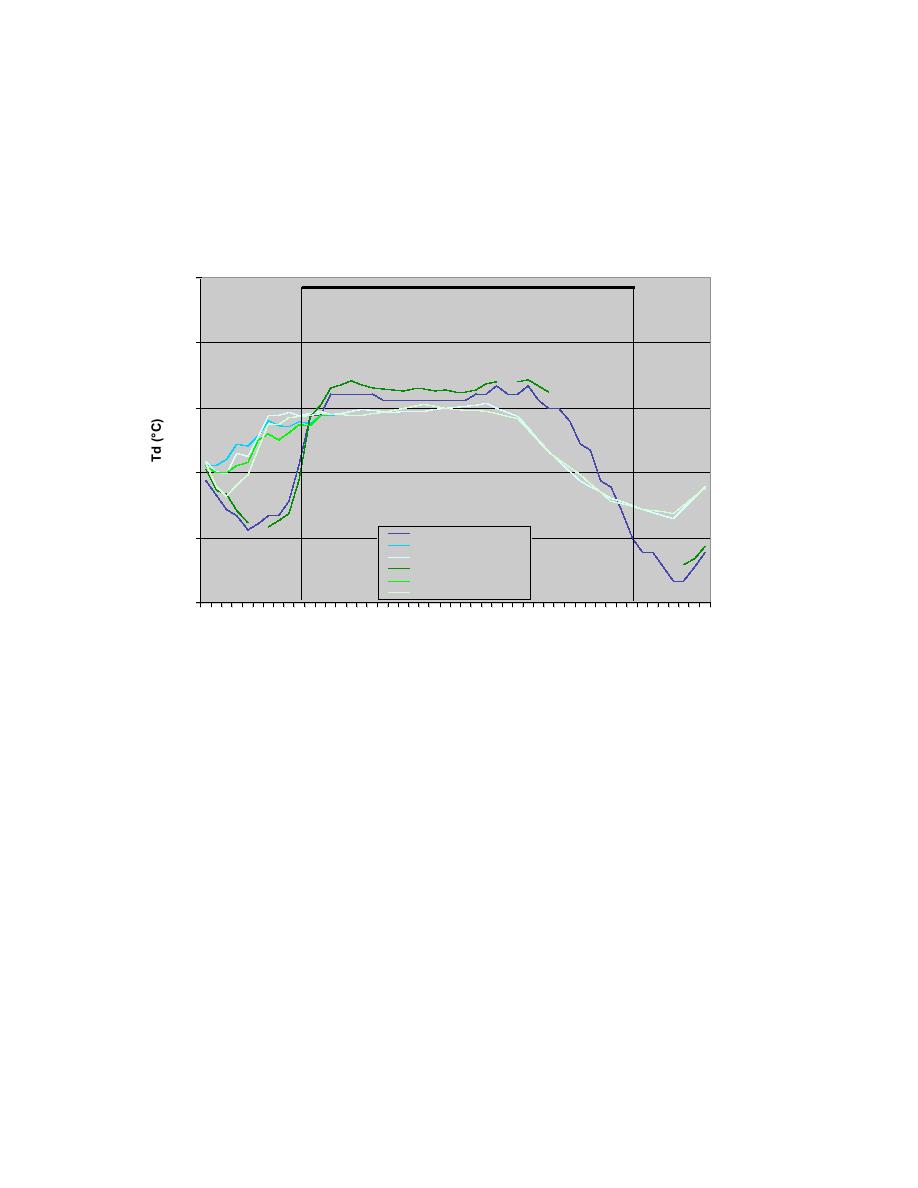
except that the forecasts were too high before and after the event. Considering the
difficulty in predicting this parameter the forecasts were reasonably good. Neither the air
temperature or dew point temperature forecasts were significantly different between the
runs made with and without the FSL models.
Dew Pt Temperature Comparison for Jan 26, 2004
0
AMW OB
-5
-10
-15
AMW METAR OB
-20
AMW METAR wFSL
AMW METAR woFSL
AMW RWIS OB
AMW RWIS wFSL
AMW RWIS woFSL
-25
18 20 22 0
246
8 10 12 14 16 18 20 22 0 2 4 6 8 10 12 14 16 18
Time (UTC)
Jan 26, 2004
Jan 27, 2004
Fig. 10.16. Same as Fig. 10.15, except for dew point temperature (C).
Wind speed and direction forecasts were important for this case because blowing and
drifting snow occurred toward the end of the event. The wind speed (Fig. 10.17) and
direction (not shown) forecasts matched the METAR and RWIS observations quite well
during the entire event. The blowing snow alert algorithm had not yet been added to the
MDSS at the time of this event, so no alerts were issued in real time. However, post-
analysis runs of the algorithm for this case indicated the highest level alert (of 3 levels)
would have been activated from 06 UTC to 16 UTC on the 27th along road segment 3.
The second highest level was indicated from 18 UTC on the 26th to 21 UTC on the 27th,
except for a couple of hours where winds speeds were low. Even though there were no
real time alerts issued, the accurate wind speed and direction forecasts gave maintenance
personnel a heads up to the shift in wind direction and increase in speed at the end of the
event and they could take this into account in their planning process. Again, there were
no significant differences between the forecasts with and without the FSL models.
41


 Previous Page
