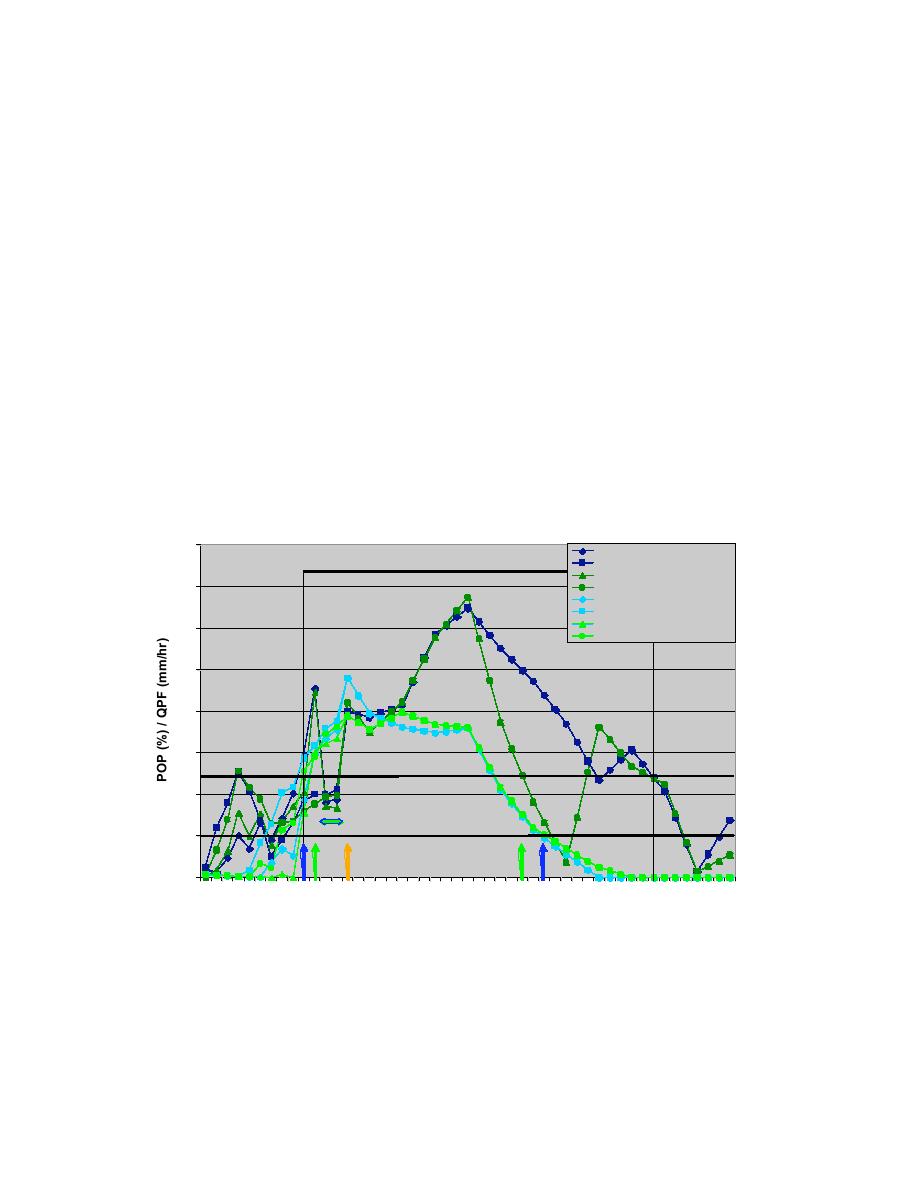
For this event the forecast start of the snow at the METAR site with FSL model input
included was predicted to be essentially the same time as the actual precipitation start (03
UTC 26 January). The start time for the RWIS site was predicted to be one hour later,
but since RWIS stations do not have a precipitation gauge there is no way to verify the
actual start time at that site. The "with-FSL" run did indicate a two hour break in the
snow from 05 06 UTC 26 January for both sites, which did not occur. Without the FSL
models the start time for both the METAR and RWIS site was not predicted until 07 UTC
26 January due to the fact that the POPs were below the threshold, so the FSL models
helped significantly for the timing of the precipitation initiation for this event. The actual
end time for this event was 41 hours out from the run time of this time series. Since the
FSL models only go out to 15 hours, only the forecasts without the FSL models could be
evaluated after that point. The end time for the RWIS site was forecast to be 23 UTC on
26 January and for the METAR site was 01 UTC 27 January, 10 12 hours off from the
actual end times. Examination of a later RWFS run from 18 UTC on 26 January revealed
that the end times were still forecast to be too early compared to the observations at the
METAR site (Fig. 10.20). The end times were pushed back a few hours from the 18
UTC, 25 January run, but still occurred about 10 hours before the actual end time.
POP and QPF for Jan 26, 2004
0.8
AMW METAR POP wFSL
AMW OB
AMW METAR POP woFSL
AMW RWIS POP wFSL
0.7
AMW RWIS POP woFSL
AMW METAR QPF wFSL
AMW METAR QPF woFSL
AMW RWIS QPF wFSL
0.6
AMW RWIS QPF woFSL
0.5
0.4
0.3
POP Threshold
0.2
break in SN wFSL QPF Threshold
0.1
METAR/RWIS woFSL Start
0
METAR wFSL Start RWIS wFSL Start
RWIS w/woFSL End METAR w/woFSL End
18 20 22
0
2
4
6
8
10 12 14 16 18 20 22
0
2
4
6
8
10 12 14 16 18
Jan 27, 2004
Jan 26, 2004
Fig. 10.19. Same as Fig. 10.15 except for probability of precipitation (%)
and quantitative precipitation forecast (mm/hr). The blue arrows indicate
the forecasted start (with FSL) and stop (with and without FSL) times at
the METAR site, the green arrows indicate the start (with FSL) and stop
(with and without FSL) times at the RWIS site and the orange arrow
indicates the start time at both the METAR and RWIS site without FSL.
44


 Previous Page
