10
F
1
rom 3-Axis Sonic
Best Data
F
Questionable Data
rom Eddy-Correlation
Vertical Sonic
0.1
0.01
10
1
0.1
0.1
1
z/L
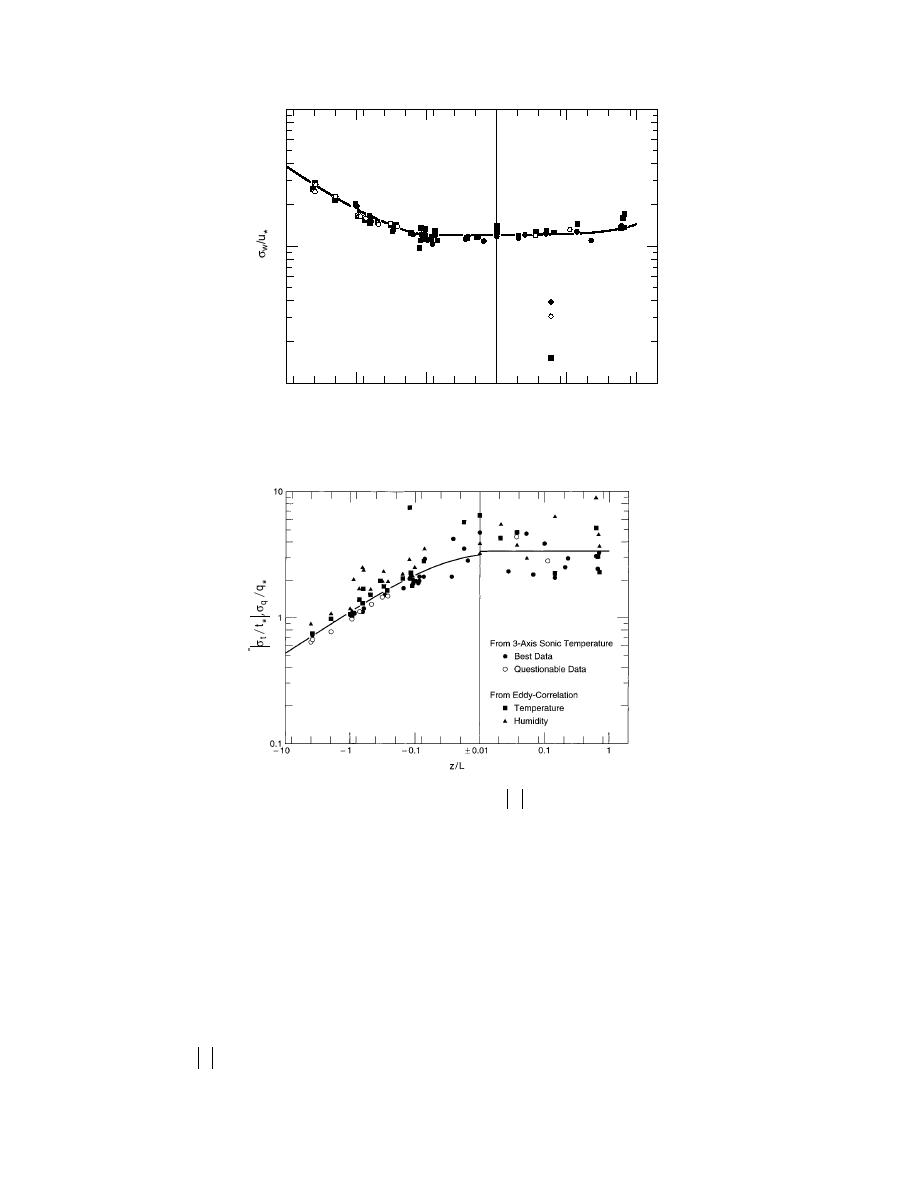
a. Standard deviation of vertical velocity, σw. The line is σw/u* =
1.20(0.70 3.0ζ)1/3 for 4 < ζ ≤ 0.1, 1.20 for 0.1 ≤ ζ ≤ 0, and
1.20(1 + 0.2ζ) for 0 ≤ ζ < 1.
b. Nondimensional standard deviations of the scalars temperature
(σt) and humidity (σq). The line is σs / s* = 3.4(1 - 28.4ζ)-1 / 3 for
4 < ζ ≤ 0, and 3.4 for 0 ≤ ζ < 1.
Figure 1. Demonstration of Monin-Obukhov similarity theory using
data collected over a semi-arid grassland in New Mexico in August
1991. One anemometer was a three-axis sonic anemometerthermometer;
the other was a single-axis sonic that was part of an eddy-correlation sys-
tem manufactured by Campbell Scientific. The three-axis sonic yielded u*
for nondimensionalizing both sets of σw measurements. Questionable data
were collected in a directionally variable wind.
ations seem to be independent of ζ.
tainty in the u* measurement (see eq 55 and 56). Never-
theless, both the temperature and the humidity data do
There have been many other confirmations of
seem to collapse to a single functional form and, thus,
Monin-Obukhov similarity theory in the last 30 years
to confirm the predictions of MOST. In particular, for
(see Haugen [1973] and Panofsky and Dutton [1984] for
ζ < 0.1, σ t / t and σq/q* go as (ζ)1/3, as eq 66 pre-
reviews), and it is now the foundation for our understand-
*
dicts. And for ζ > 0, the nondimensional standard devi-
ing of processes in the atmospheric boundary layer.
9


 Previous Page
