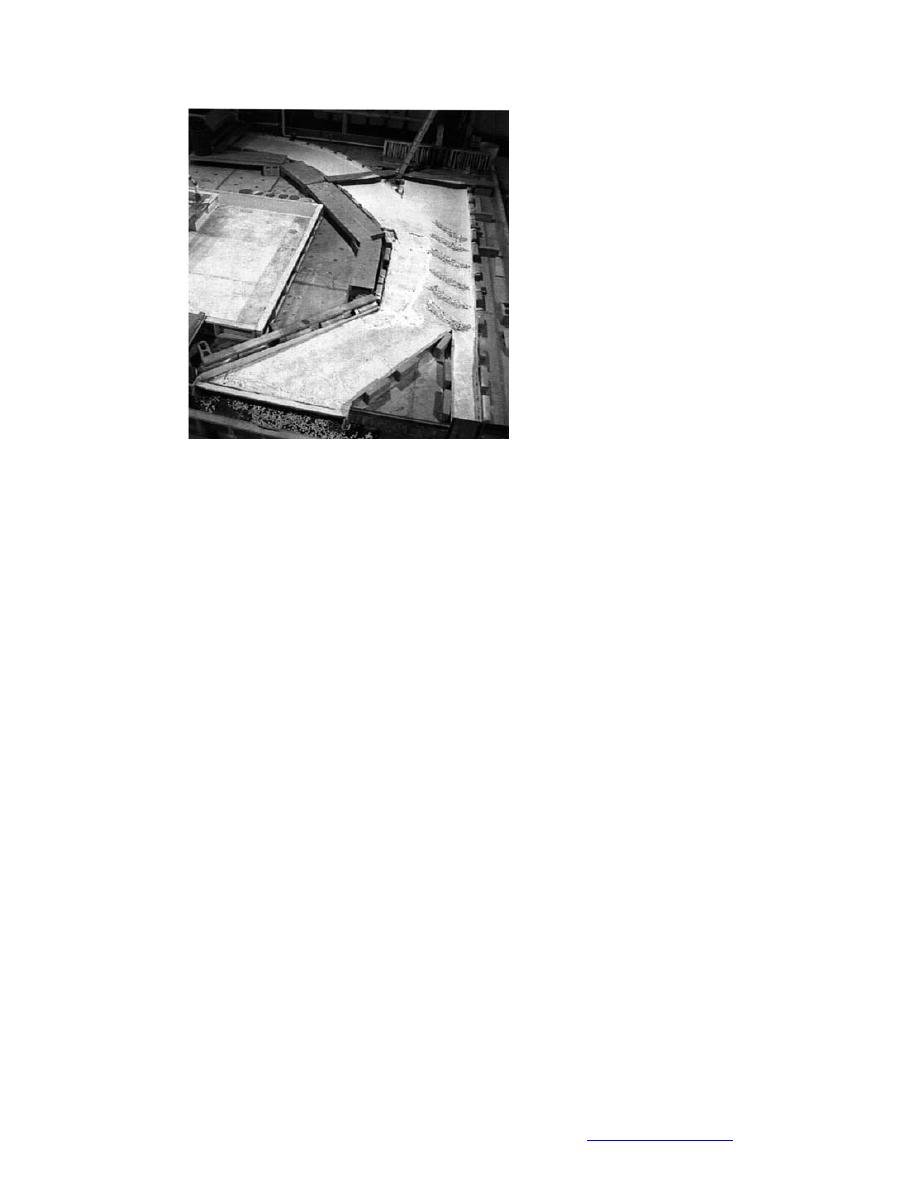
wider than the equivalent
full-scale width of 3.2 m. Fig-
ure 43 illustrates the model
confluence fitted with the
model bendway weirs.
I n accordance with the
findings of the background
study into conditions lead-
ing to ice jam formation in
the confluence, the model-
scale flow rates selected for
the Missouri and Mississippi
Rivers were 25,000 cfs and
40,000 cfs, respectively. These
flow rates are in the low flow
ranges for which the conflu-
ence bar is exposed and the
confluence constricted. In
Figure 43. Photograph of the confluence of the Mis-
several respects these base-
sissippi and Missouri Rivers model (with bendway
line model flow and ice con-
weirs).
ditions are approximately
those associated with the ice jam that occurred on 9 January 1979 (Fig. 36).
The model's scale flow rates were set in accordance with the criterion of Froude-
number similitude (see, e.g., Zufelt and Ettema 1996). Water flow rates in both
rivers were controlled using valves and measured using orifice meters positioned
in the supply lines. Water depths were controlled using a sharp-crested, overflow
tailgate.
As ice jams at the confluence are primarily attributable to ice floes discharging
from the Missouri River, ice was released into the modeled channel of the Mis-
souri River. Ice was modeled using the same 3-mm-diam. polypropylene beads
(specific gravity = 0.90) used for the diagnostic model. The equivalent full-scale
diameter of the model ice is about 3 m. Ice release into the modeled Missouri channel
was controlled using a hopper mounted above a variable speed, rotating convey-
or belt. By varying belt speed, and by adjusting the opening of a slide gate above
the belt, the rate of ice release would be varied into the model.
Border ice in the vicinity of the bar was modeled in a simple manner using a row
of small bricks placed along a perimeter and representing the extent of border ice
growth in the model confluence. The row of bricks was not watertight, so that
water could flow at a sluggish rate through the area of simulated border ice, but
model ice was constrained to the constricted channel through the confluence.
Flow and ice velocities
The velocity fields of water flow and ice movement in the model confluence, for
each bathymetric configuration, were determined using large-scale particle image
velocimetry (LSPIV). The resultant vector plots of the velocity fields provided a
useful quantitative method for analyzing spatial and temporal patterns of water
flow and ice movement in the confluence. The whole fields of velocity portrayed
in the vector plots are especially useful for studying the conditions incipient to ice
jamming, because they quantitatively reveal how the ice responds all through the
confluence area as jamming begins.
51
Back to contents page


 Previous Page
