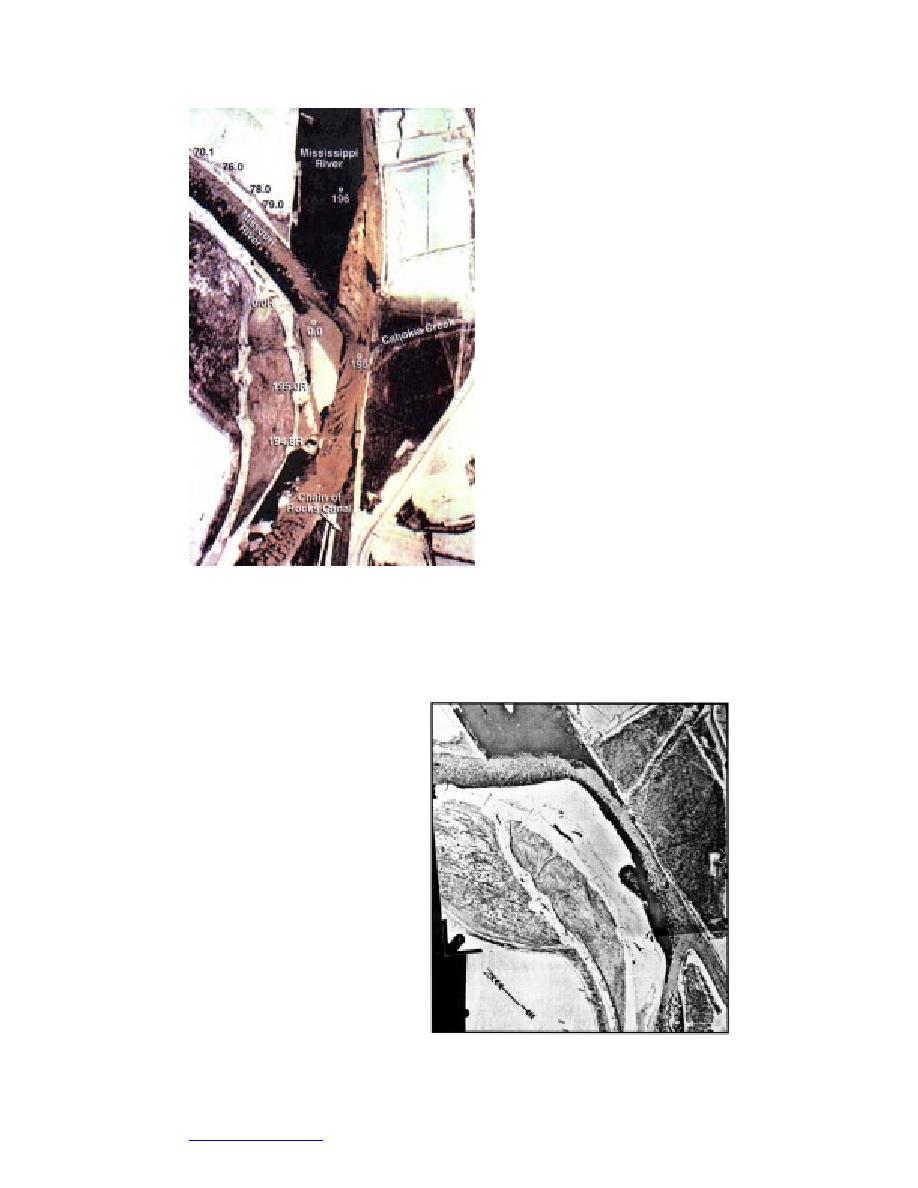
The photographs in Figures 35, 36,
and 37 illustrate the three jams that
occurred at the confluence during
the winters of 19771978, 197879,
and 198081. For all the jams, expo-
sure of the bar during low flow con-
ditions and extensive border-ice
growth around the bar severely con-
stricted ice discharging from the
Missouri River. In addition, ice drift-
ing with flow from the Mississippi
River worsened the constriction.
When the bar was under water,
during comparatively high flow rates
in the Missouri and Mississippi
Rivers, ice discharging from the
M i s s o u r i River passed without
undue congestion through the con-
fluence. The Figure 38 photograph
illustrates this condition for an ice
run event on 4 February 1985. Even
though this ice run involved a larger
volume of ice than the ice-run events
illustrated in Figures 35, 36, and 37,
Figure 35. Ice jam in the confluence of the Mis- jamming did not occur.
sissippi and Missouri Rivers on 26 January
In summary, study of the factors
1978.
associated with ice jams in the con-
fluence of the Missouri and Mississippi Rivers indicates the significant adverse
influence of the bar at a confluence. This finding is supported by observations at
several other confluence locations and by the jam process modeling described
above. It indicates that, to signif-
icantly increase the ice convey-
ance capacity of the confluence,
the bar should be reduced in
width. Indeed, this finding has
been recognized by the Corps in
their concern for increasing the
ice conveyance capacity of the
confluence of the Missouri and
Mississippi Rivers. On the as-
sumption that a reduced bar size
would increase ice conveyance,
the Corps has begun river engi-
neering activities to reduce the
bar. They have placed several
submerged rows of rocks, termed
bendway weirs, to force the thal-
weg of the confluence toward the
Figure 36. Ice jam in the confluence of the Missis-
bar, and thereby to diminish the
sippi and Missouri Rivers on 9 January 1979.
bar by erosion. Figure 39 indicates
46
Go to contents page


 Previous Page
