Table 2. Aerial photographs of ice conveyance through MississippiMissouri confluence.
Average monthly
temperature
(F)
(C)
Date
Ice status
Ice source
12/17/76
Congestion, no border ice
Missouri
28.5
1.9
01/26/78
Jamming, border ice
Missouri
19.6
8.8
01/09/79
Jamming, border ice
Missouri
16.6
8.5
02/05/79
Light ice run, no border ice
Missouri
23.1
4.9
02/10/81
Severe jamming, no border ice
Missouri and Mississippi
36.8
2.7
02/04/85
Heavy ice run, no border ice
Missouri
30.5
0.8
02/09/89
Light ice run, no border ice, sand bar
Missouri
28.2
2.1
12/1620/89
Severe jamming (worst case), border ice
Missouri
24.1
4.4
01/19/94
Heavy ice run, no border
Missouri
26.8
2.8
01/09/96
Light ice run, no border
Missouri
N/A
N/A
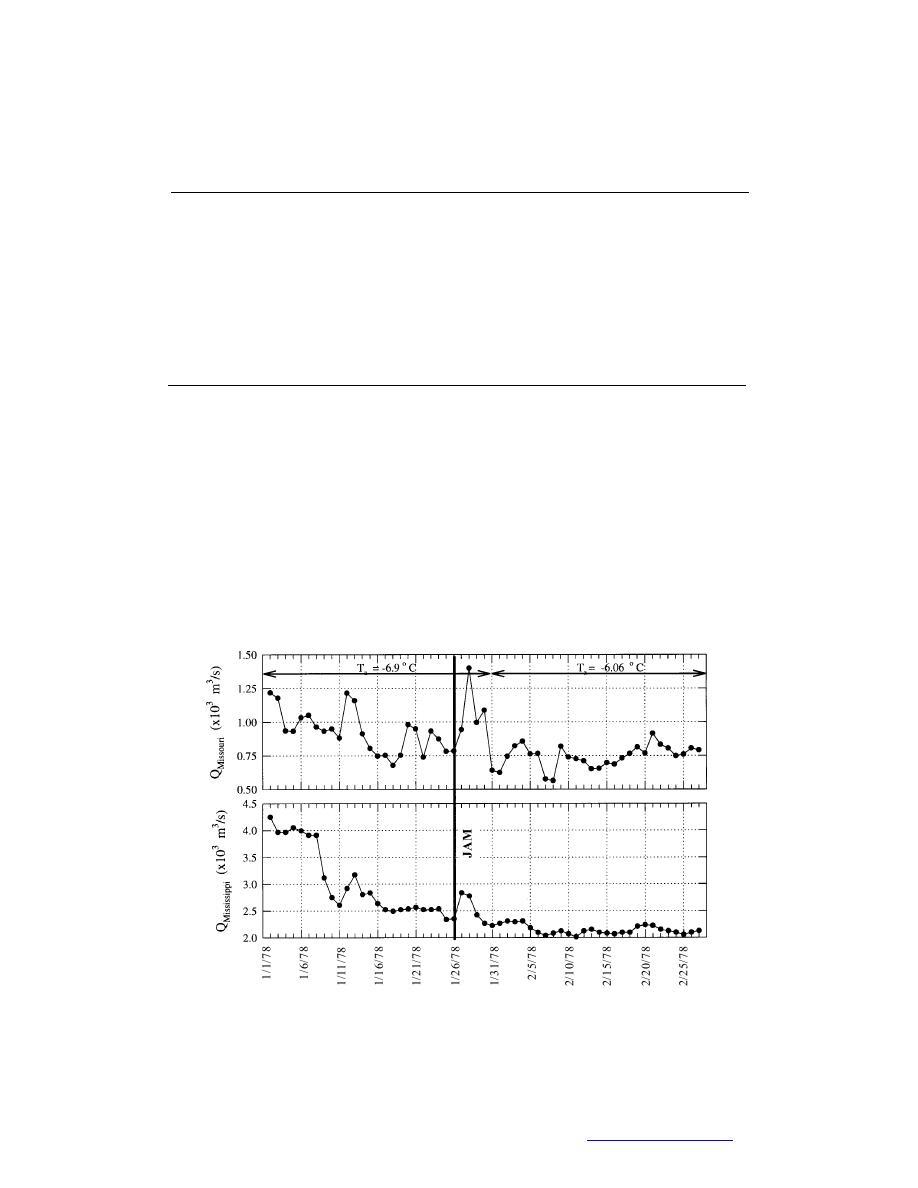
ice jams occurring during these three winters. Figure 34 shows the daily average
flow rate in the Missouri River during these periods. The flow rates were recorded
at a stage gage located at Hermann, Missouri, a short distance upstream from the
confluence. Also shown are the average monthly air temperatures at St. Louis,
Missouri, during these periods, and the occurrence of jams in the confluence. Clearly
the jams are freezeup jams the winters illustrated, occurring during periods of
low discharge in the Missouri and Mississippi Rivers. The plots show that ice jams
occur in the confluence when the flow rate in the Missouri River has dropped to
about 20,000 cfs (566 m3/s) to 30,000 cfs (850 m3/s) , and flow in the Mississippi
Date
a. For the period 2 January 1978 to 27 February 1978.
Figure 34. Record of flow discharges in the Mississippi and Missouri Rivers. Also
indicated is the average monthly temperature for the region.
43
Back to contents page


 Previous Page
