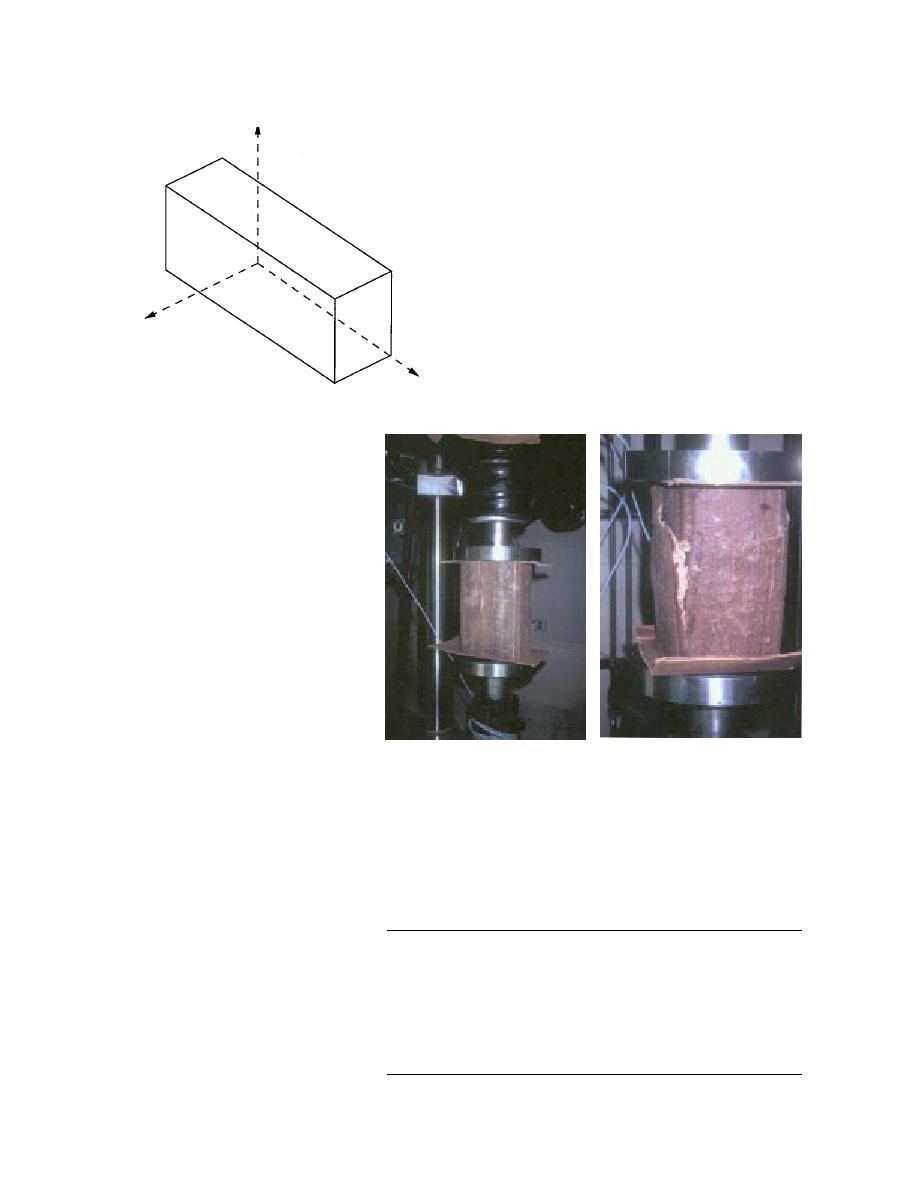
two temperatures, 21C (70F) (room tempera-
y (Transverse)
ture) and 30C (22F) (low temperature).
The results shown in Table 7a show that the
moisture percentage tends to increase with the
smaller sized specimens. All compression tests
were performed using a servohydraulic uni-
versal testing machine with an electrical data
acquisition system. For low-temperature test-
ing, the specimens were kept cooled in a
coldroom for at least 24 hours before being
transferred to the test chamber built on the
universal testing machine, which was kept
z
cooled by a special refrigeration system built
(Cross transverse)
for the purpose. Typical testing of a longitu-
dinal beam in the test chamber is shown in
Figure 43. The results from all tests are sum-
x (Longitudinal)
marized in Table 7b for the room-temperature
Figure 42. Axial orientations of the RPC test specimens.
Compression testing
Since the production process of
the RPC involved a pultrusion-type
manufacturing technique in which
the raw materials are heated and
compressed in the reaction chamber
and the curing material is extruded
out, it was suspected that there
would be some directional variabil-
ity of the properties in the material.
Therefore, compression tests were
performed in three axial directions,
x, y, and z, as shown in the schematic
in Figure 42. Direction x coincides
with the longitudinal direction,
which is the pulling direction of the
beam out of the molding die; y is the
major transverse direction of the rect-
b. After failure.
a. Before failure.
angular section; and z is the minor
Figure 43. Axial compression testing of the full-sized (152 203 mm,
direction. Specimens with x direction
6 8 in.) guardrail post beam.
had a designated letter L, in y direc-
tion T, and z direction TT. The dry
groups were designated with the let-
Table 7. Compression testing of RPC specimens.
ter D and the wet group with letter
W as shown in Table 7a. For compres-
a. Specimen sizes and moisture ingression data.
sion testing in the x-direction, the sides
Nominal
Avg. dry
Immersion
Avg. wet
Moisture
of the sample were not machined;
Specimen group
size
density
time
density
absorbed
(lb/in.3)
(lb/in.3)
(grain orient.)
(in.)
(hr)
(%)
rather they were left with the round-
ing corners of the general 152- 203-
6 8 12
DL
(x)
0.0315
0.00
mm (6- 8-in.) cross section, as they
6 8 12
WL
(x)
0.0317
139.00
0.0318
2.203
6 8 12
WCL
(x)
0.0312
47.50
0.0314
0.641
were received. The nominal dimen-
4.5 5.5 6.5
DT
(y)
0.0326
0.00
sions of the specimens and their
4.5 5.5 6.5
WT
(y)
0.0324
41.00
0.0330
2.240
moisture contents before tests are
4.5 5.5 6.5
WCT
(y)
0.0322
47.50
0.0328
1.862
given in Table 7a.
3 3.5 4.5
DTT
(z)
0.0321
0.00
3 3.5 4.5
The properties were determined
WTT
(z)
0.0327
41.00
0.0330
2.690
3 3.5 4.5
WCTT
(z)
0.0321
47.50
0.0331
3.115
for both wet and dry conditions at
29


 Previous Page
