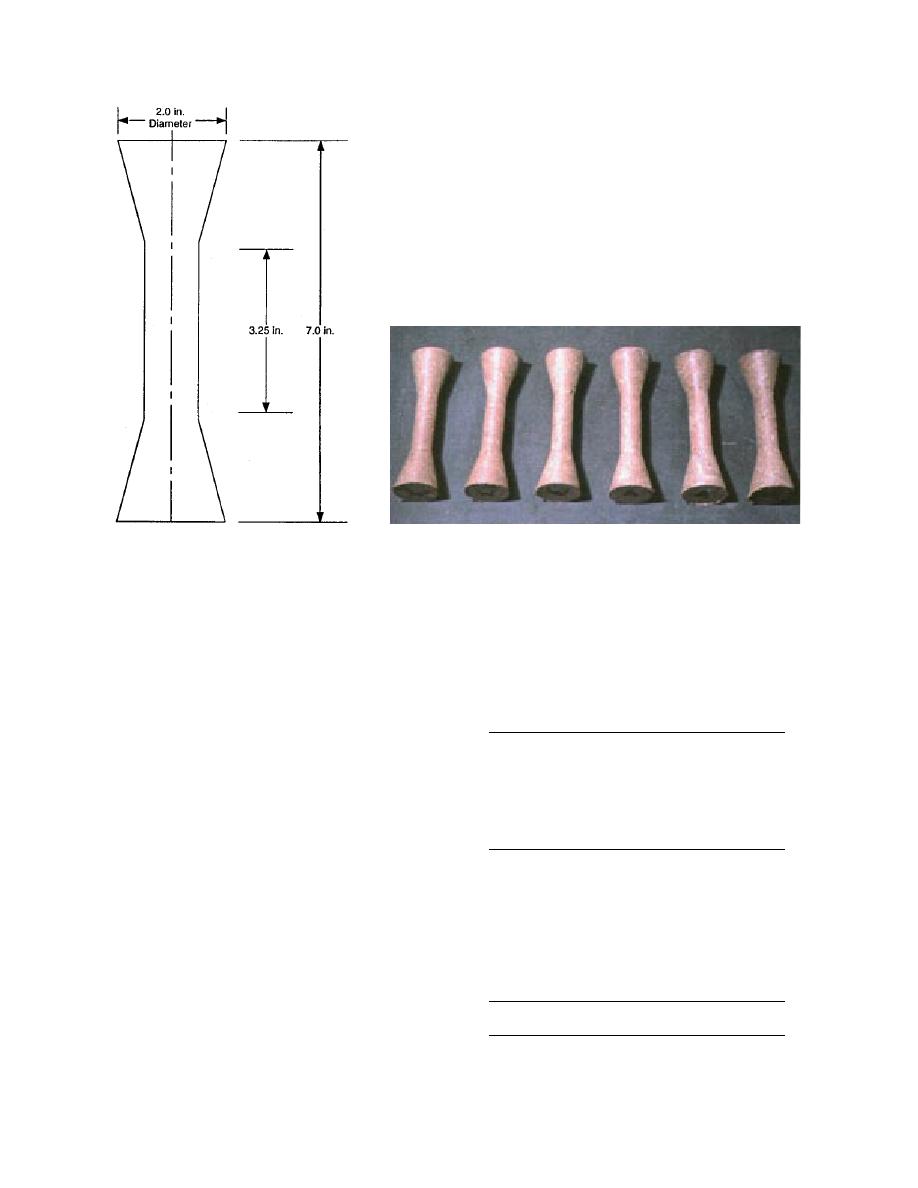
b. Some RPC tensile test specimens machined from the 152- 203-
a. Tensile test specimen dimensions for
mm (6- 8-in.) beams.
the RPC material.
Figure 48. Tensile test specimens for the RPC material.
ture for testing these specimens was also designed,
Table 8. Tensile test data of RPC.
as shown in Figure 49. Figure 49a shows the fix-
ture cover plate removed, and Figure 49b shows
Specimen
Peak load
Area
Strength
(in.2)
(lbf)
(psi)
(psi)
Modulus
the cover plate closed. Again, the tension tests
were conducted in the servohydraulic machine
x direction specimens
with a cross-head displacement rate of 2.54 mm
W1
372.0
0.7933
468.93
23,628
(0.1 in.) per min. An electrical data acquisition sys-
W2
290.5
0.7838
370.63
19,383
W3
N/A
0.8028
N/A
14,290
tem was used to record the test data. From the
152 203-mm (6 8-in.) beams supplied by the
W4
332.5
0.7948
418.34
28,432
W5
400.0
0.7933
504.22
31,570
manufacturer, six specimens, W1 through W6,
W6
240.0
0.7933
302.53
19,637
were machined from the longitudinal direction (x),
Average
412.92
22,823.33
and six specimens, A1 through A6, were machined
Std. dev.
79.81
6,378.33
from the major transverse (y) direction. Figures
y direction specimens
50a and b show the typical stress-strain curves for
A1
512
0.8075
634.06
27,820
the tensile loading in the x and y directions. The
A2
487.5
0.7917
615.76
23,046
properties were determined only in the longitu-
A3
332
0.7964
416.88
29,116
dinal (x) and the major transverse (y) directions
A4
321.5
0.7948
404.50
25,502
at room temperature The results of the tension
A5
334
0.7933
421.03
26,307
A6
413.5
0.8028
515.07
35,130
tests are summarized in Table 8.
Average
501.22
27,820.17
These results are graphically presented in Fig-
Std. dev.
103.78
4,136.88
ure 51. Figure 51a gives the tensile strength data,
and Figure 51b give the elastic modulus for the x
SI conversion factors: 1 lbf = 4.45 N, 1 in.2 = 645 mm2 ,
direction specimens. Figures 51c and d give the
1 psi = 6.89 kPa.
34


 Previous Page
