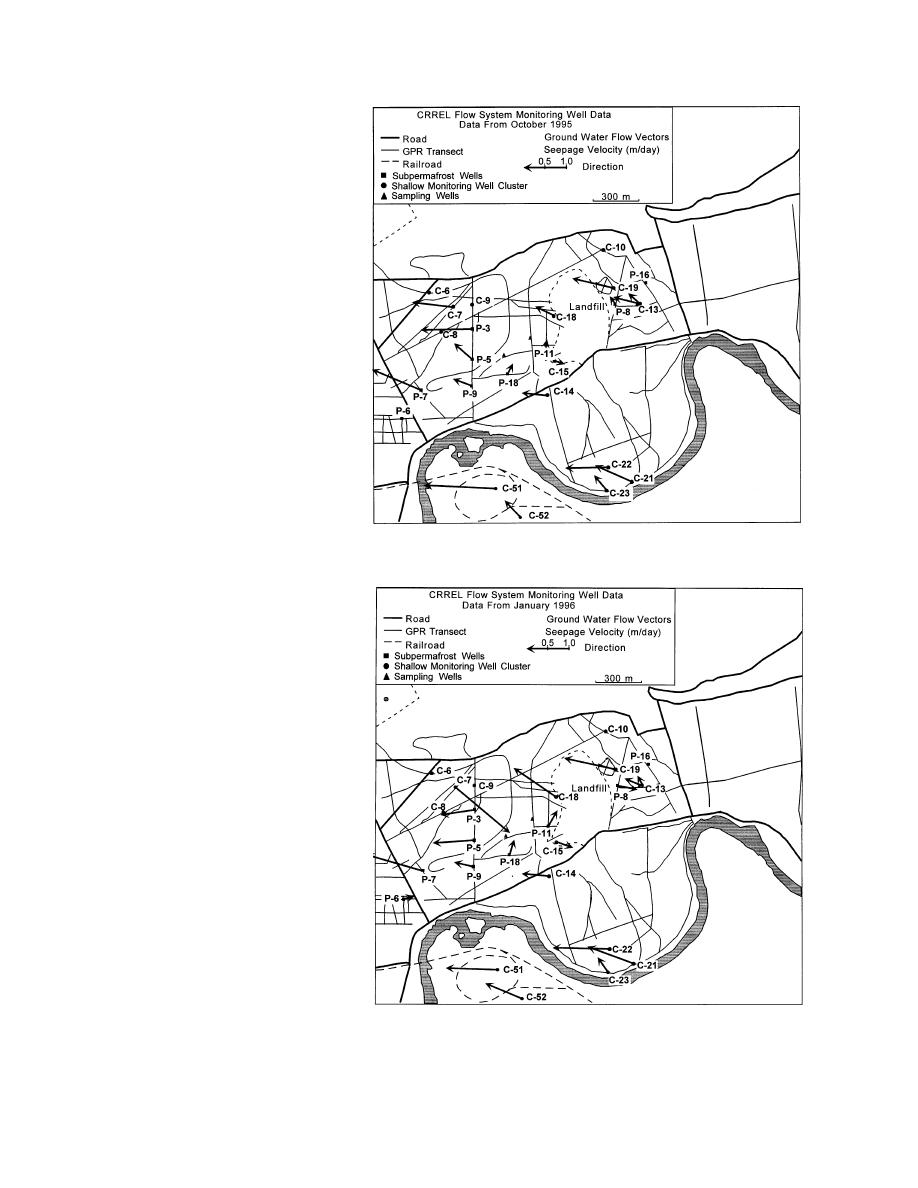
velocity, and, to a lesser extent, flow
direction (App. A). The period of
record is, however, too short to
determine how representative these
data are of long-term trends in flow.
Diurnal and average weekly val-
ues are reasonably consistent in any
given well; however, flow velocity
may vary at depth, reflecting
changes in stratigraphy that influ-
ence the hydraulic conductivity.
Seepage velocities typically range
from 0.3 to 1 m/day, although rates
of less than 0.15 and greater than 1.5
m/day were recorded. These high-
er values likely reflect local differ-
ences in gradient, hydraulic con-
ductivity, or permafrost confine-
ment.
The velocity of near-surface flow
varies inversely with seasonal
water level fluctuations. Velocities
generally increase as water levels
decline during the fall and winter,
a. October 1995.
but decrease in the spring and sum-
mer (App. A). Paino (1997) suggested
that higher velocities during winter
may reflect an increased confine-
ment or changes in flow paths and
water flux caused by seasonal freez-
ing of near-surface sediments. Frost
commonly extends 4 m or more in
depth each winter in this region
and, as a result, can completely
freeze thin active layers. This can
isolate parts of suprapermafrost
aquifers and reduce the overall vol-
ume of a near-surface aquifer.
Flow directions in near-surface
(10-m) and, to a lesser degree,
deeper (20-m) wells show the
effects of permafrost. Wells located
in unfrozen materials that are
bounded on the sides by frozen
sediments tell us that flow diverges
from the overall northwesterly flow
pattern north of the Chena River
(App. A). Flow patterns also reflect
seasonal changes in water levels.
With thawing of seasonally frozen
ground, formerly isolated aquifers
b. January 1996.
may open, permitting communica-
tion, and significantly changing
Figure 21. Averaged flow vectors for subpermafrost and deep (30-m) wells,
flow direction (Paino 1997).
shown with respect to permafrost distribution.
22


 Previous Page
