50 N
0
500 km
45 N
>30
MTW
20
>30
Z
10
45
<5
25
40
20
<5
22
20
5
10
30
20
40
N
5
10
<5
10
>5
20
95 W
90 W
85 W
80 W
75 W
Figure 1. Mean annual number of subzero (<17.8C) days occurring during the period
195180, from NOAA (1982). The Canadian data were provided by D. Phillips, AES,
Downsview, Ontario. The study area of Figure 3 lies along the Connecticut River near Z.
10
Snow Cover
Discontinuous
5
Thin
X
Total Cover > 5 cm
0
rm
X
he
ot
X
5
X
Is
tic
a
ab
i
Ad
10
X
15
X
X
X
20
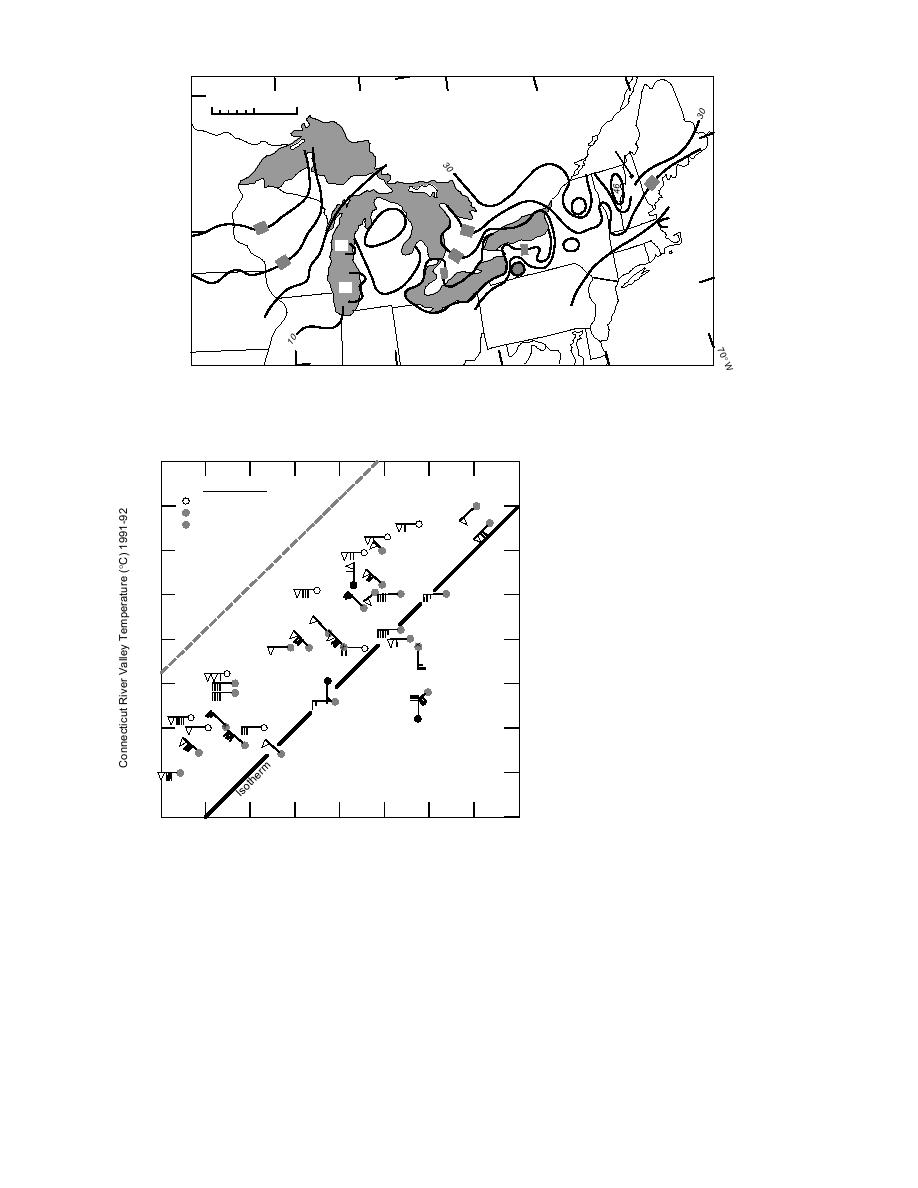
Figure 2. Comparison of 07LCL(12UT)
X
temperatures observed at Mt. Washington
and Piermont, New Hampshire, during the
25
X
winter 199192. The station circles denote
snow cover at Z; the wind barbs denote
30
wind speed (5 m/s per barb) and direction
35
30
25
20
15
10
5
0
5
Mt. Washington Summit Temperature (C)
at Mt. Washington.
produced by the radiational heat loss at the snow/
Magono et al. (1982). Namias (1985) suggested
air interface. The magnitude of this decoupling
synoptic scale influence of snow cover on tem-
effect may be influenced by local features, caus-
perature and precipitation. Dewey (1977) showed
ing some of the observed variation in local tem-
that the presence of snow cover locally influenced
perature.
daily maximum and minimum temperature.
There are many examples in literature of dimi-
Longley (1949) analyzed a 100-year climatic record
nution of surface air temperature over snow cover
at Quebec, and showed the spring increase of
reviewed in Munn (1966). Large local tempera-
morning minimum air temperature to stagnate at
0C for several days, until the snow cover dimin-
ture variations have been observed in Alaska by
Benson and Bowling (1973) and in Hokkaido by
ished. The addition of the influence of snow-
2


 Previous Page
