

24
18x105
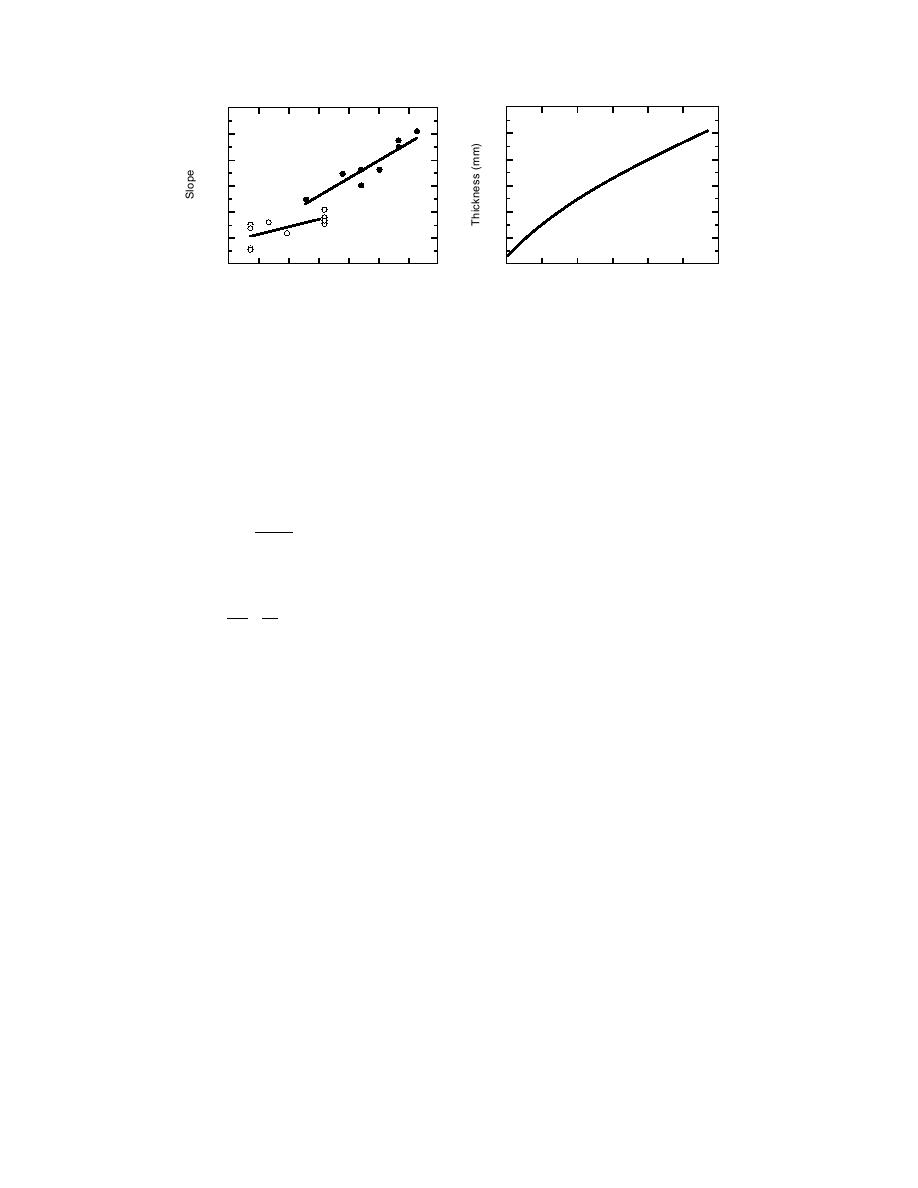
After Failure
16
14
8
10
Before Failure
6
0.02
0.03
0.04
0.05
0
0.02
0.04
0.06
Discharge (m3/s)
Discharge (m3/s)
Figure 19. Slope vs. discharge, showing in-
Figure 20. Calculated equilibrium jam
crease in slope after jam failure.
thickness vs. discharge.
in which u is average flow velocity and R is the composite or total hydraulic radius.
An average value of fo was calculated and used for the conditions before and after
failure. The detailed velocity profiles from each test provided data on the ratio of
the bed-affected to ice-affected hydraulic radii. Then, using the Sabaneev equa-
tions
fi + fb
fo =
(32)
2
and
f
Ri
= i
(33)
Rb fb
it is possible to determine ratios of fi to fb and fi to fo. Average values of these ratios
for the conditions before and after failure were calculated and used to calculate the
equilibrium cover thickness expected for each experiment. Figure 20 is a plot of the
equilibrium thickness vs. discharge for this series of experiments, using average
values of fo and fi/fo.
Figure 21 follows the changes in thickness experienced with step changes in
discharge for one of the experiments. The initial thickness of a bead jam is slightly
greater than that predicted using the equilibrium theory (eq 30) and was between
one and two beads thick. Two step increases in discharge were necessary before a
shoving and thickening event occurred, with the resulting thickness again slightly
greater than that expected by theory. This first failure was a progressive jam failure
with very small ice velocities. Two more step increases in discharge were necessary
to again cause jam failure. The second failure was a complete jam failure, with the
whole cover mobilizing en masse and thickening taking place initially at the down-
stream screen. The final thickness was significantly greater than the equilibrium
value for that flow level.
The jam failures in each experiment were identified as either progressive or com-
plete jam failures. The final thickness following failure was plotted in Figure 22
against the equilibrium thickness predicted using eq 30. The progressive jam fail-
ures resulted in accumulation thicknesses that plotted on or very slightly above the
equality line in the figure. The complete jam failures, however, exceeded the equi-
librium thickness in every case, often by a significant amount.
27

 Previous Page
