0.2
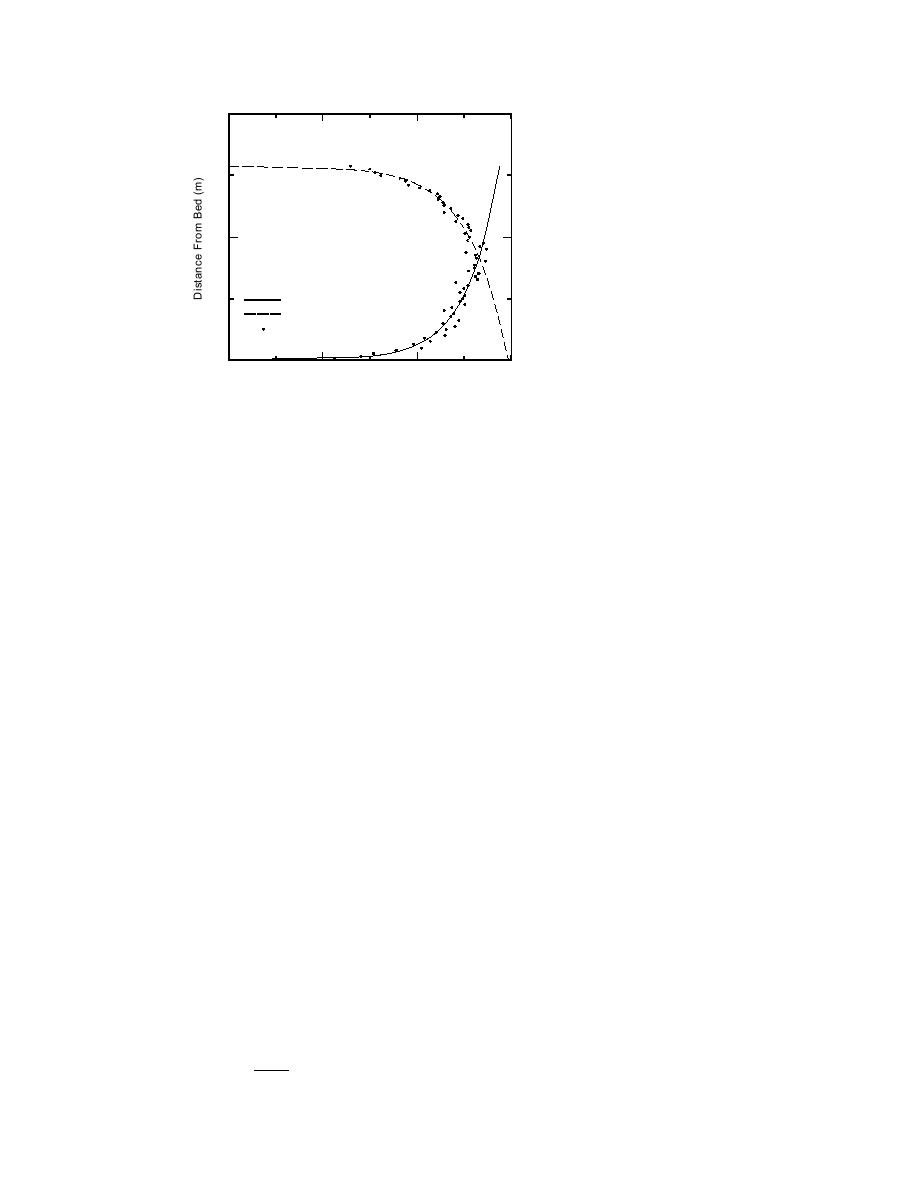
Figure 18. Measured velocity
0.1
profile with fitted log-law equa-
tions for the ice and bed-affected
areas.
Lower Layer
Upper Layer
Measured
0
0.1
0.2
0.3
Velocity (m/s)
log-law profiles calculated for the bed- and ice-affected portions of the flow area.
By assuming the line of zero shear stress to be equivalent to the intersection of the
two computed profiles, the depth of the ice-affected flow area could be determined
and the hydraulic radius Ri of that region calculated. The value of was then calcu-
lated by back substitution into eq 30, using the measured value of accumulation
thickness in the equilibrium reach. The value of was found to average 0.75 for the
three steady flow discharges considered. Though this value is at the low end of the
range of 0.81.3 reported by Beltaos (1995), it reflects the effect of the difference
between the shape of the beads and natural ice rubble. The beads are uniform in
size and approximately cylindrical in shape, thereby having an angle of repose less
than that of natural ice. The uniform shape of the beads causes their accumulations
to deform more easily under stress and results in a lower Kp and thus value than
is the case for natural ice rubble in a jam.
With a known average value of determined for the beads, further experiments
could proceed using the tiltable-bed flume without refrigeration. Fifteen experi-
ments were conducted under a variety of initial discharges and discharge increases,
as reported by Zufelt (1992). Each experiment was run in a manner similar to the
visualization series, for which a bead cover was allowed to form at a low discharge
and the flow then increased in steps until a shoving and thickening event took
place. The energy slope was assumed to be equivalent to the water surface slope,
which was calculated from measurements of water surface elevation along the flume.
Slope was plotted against discharge, and a linear relation was obtained for the
conditions before and after failure. Though a power relationship is to be expected
between slope and discharge, the linear fit was adequate for the limited range of
discharges used. The two relations also confirm an increase in jam roughness fol-
lowing failure and thickening, as evidenced by the higher slopes following failure
(Fig. 19).
The variations in slope for similar discharges before failure in Figure 19 reflect
slight variations in the configuration of the bead jam (thickness, extent, etc.)
between successive tests. The slopedischarge relation was used for further calcu-
experiment as
8gRS
fo =
(31)
u2
26


 Previous Page
