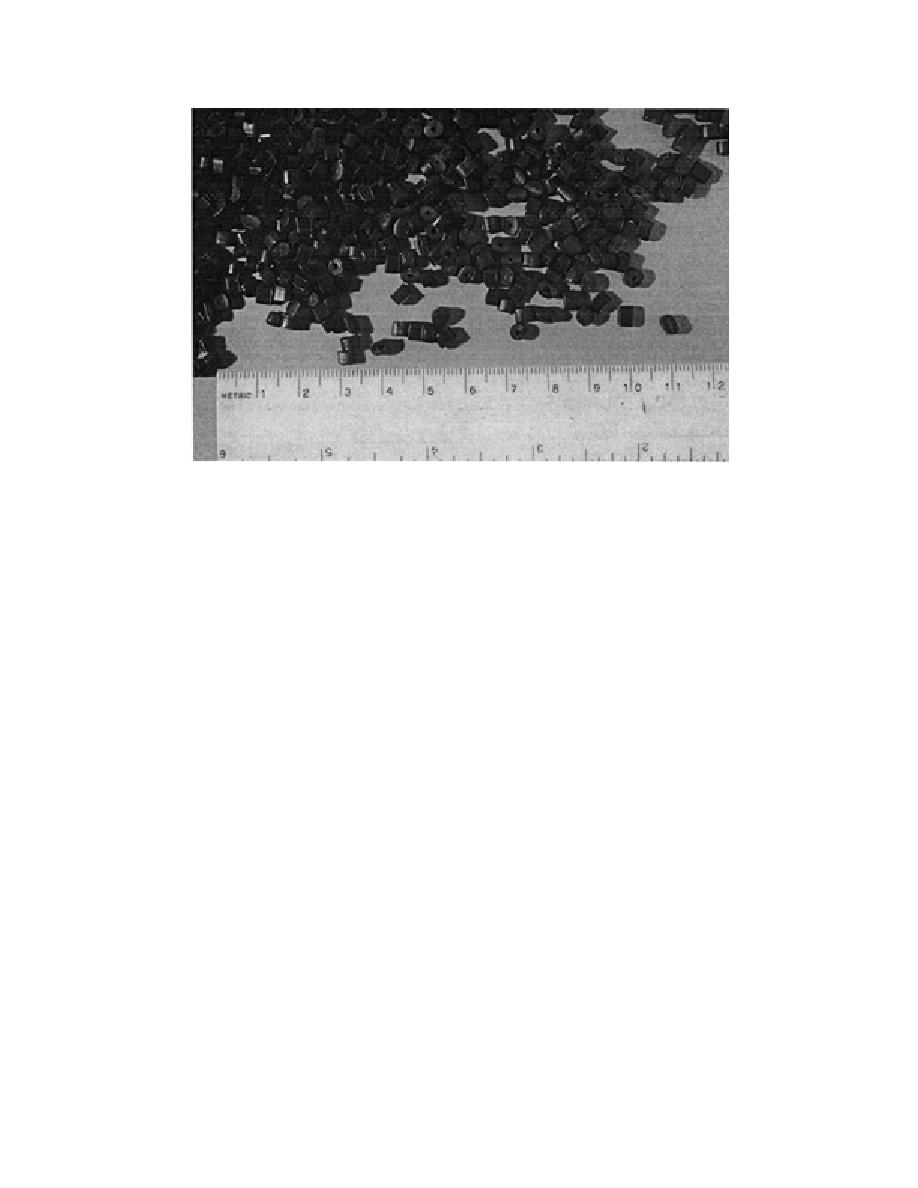
Figure 16. Plastic beads used to simulate ice.
then further increased in steps until the jam destabilized and shoving and thicken-
ing took place. Step increases in flow rate were varied from 10 to 100% of the initial
flow rate.
Tests were also conducted using plastic beads formed from extruded polyethyl-
ene strands that are chopped to produce uniform pieces approximately cylindrical
in shape with a length and diameter of 3 mm (Fig. 16). The specific gravity of the
plastic is 0.925. The beads form accumulations with a porosity of 0.40, very similar
to natural ice, and have a dry angle of repose of 36. When new beads are added to
the water, they exhibit some surface tension effects (nonwetting), but after a few
days they become fully wetted. The beads were used for the visualization experi-
ments in the tiltable flume, as well as for the quantitative testing, because of their
constant and uniform properties, as opposed to real ice. For the visualization tests,
a uniform layer of beads was spread over the water surface at a very low flow. The
flow rate was then increased to the starting flow level for the test and the bead
cover was allowed to consolidate, typically resulting in thicknesses of one to two
beads. Then, similar to the real ice tests, the flow rate was increased in steps until
shoving and thickening took place.
The quantitative experiments were conducted in two series of tests. The first
were conducted in the unrefrigerated horizontal-bed flume to determine impor-
tant physical parameters characterizing accumulations of beads. In these experi-
ments, a stable bead jam was formed at a variety of flow rates, with detailed mea-
surements taken of water surface slopes, depths, accumulation thicknesses, and
velocity profiles. From these measurements, the values of the composite, bed, and
jam underside friction factors were calculated, as was the value of for the beads.
The second series of tests was conducted using the tiltable-bed flume in a warm
environment. Similar to the visualization experiments, a bead jam was formed and
disturbed by flow-rate increases. Measurements were made of jam thickness,
extent, water velocity, water surface slope, and depth. These measurements,
together with the values determined for and friction factors, allowed the jam
22


 Previous Page
