horizons that ranged from 1 to over 4 m depth.
boulders or other buried debris. We interpreted
The difference in depth, shape, and intensity of
the linear trends (in diffractions) as trenches with
the hyperbolic returns suggested that different
multiple buried objects.
types of materials were buried in different parts
The EMI data were recorded along each transect
of and at different depths in this excavation
to verify the location of metallic targets. These
(Lawson et al. 1994). Zones of intense and uni-
data were then contoured according to the strength
form hyperbolic diffractions were interpreted as
of the readings relative to the general level of the
individually stacked and horizontally positioned
background noise. Contours of 100, 500 and 1000
cylindrical objects, particularly when these dif-
mV correspond with and refine the interpretation
fractions appeared on parallel transects. The
of the radar data (Fig. 6).
reflections from scattered targets were more diffi-
The excavation of anomalous areas (A-3 and
A-4) resulted in the removal and cataloging of a
cult to interpret and could originate from large
huge volume of material (Fig. 6).
Items recovered, which were pre-
Distance (m)
sumably buried during the 1950s,
30
25
20
15
10
5
0
included: 55-gal. (208-L) drums,
1500
miscellaneous metal containers,
Pre-excavation EMI
wooden crates, scrap metal, glass
Post-excavation EMI
1000
vials and bottles, exploded and
unexploded ordnance, chemical
500
agent test kits, and steel cylinders
containing chemical agents. The
0
record of excavation and careful
cataloging of debris allows com-
0
0
parison of our pre-excavation
survey interpretation with the
1
20
actual targets. The post-excavation
survey was conducted to verify the
2
performance of the excavation
40
contractor.
3
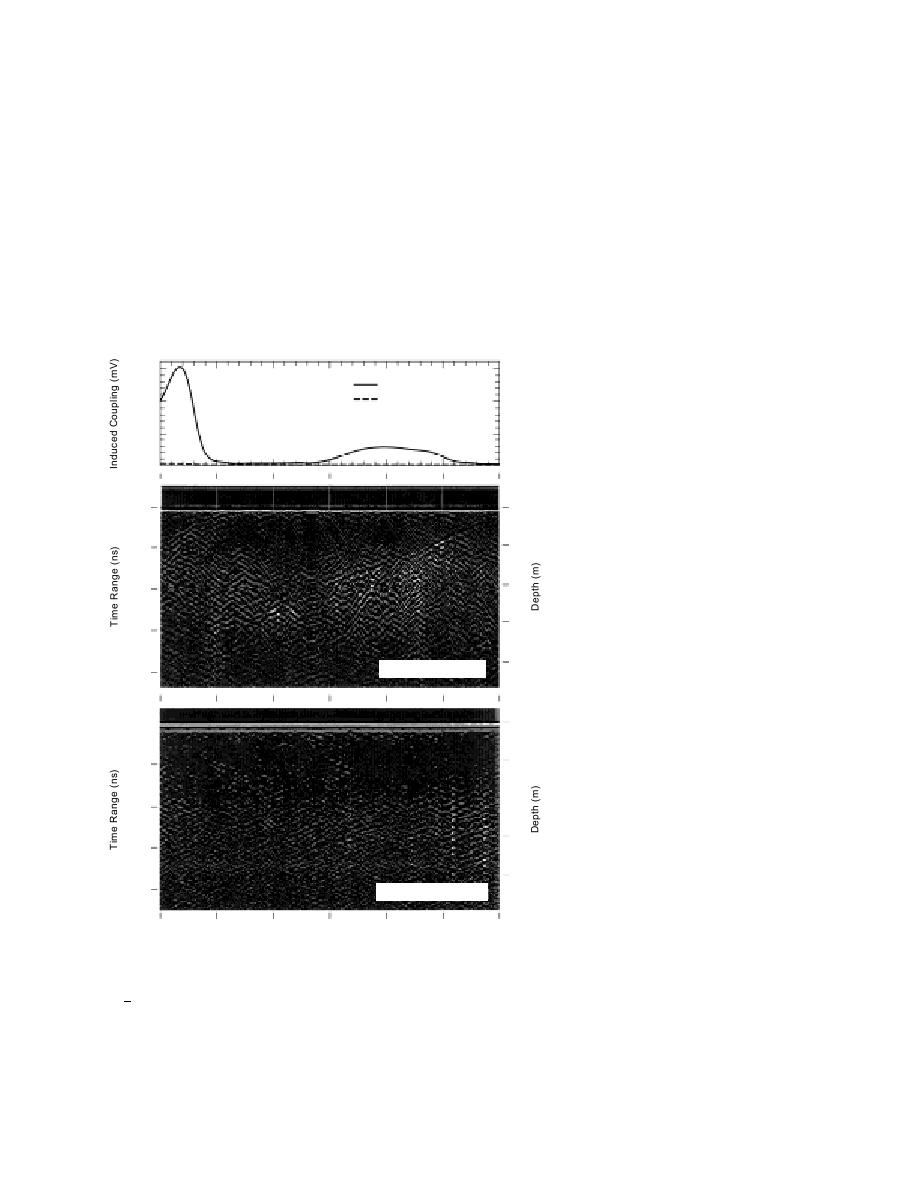
The geophysical data recorded
60
along two transects (before and
after excavation) are shown in
4
Pre-excavation GPR
80
Figures 7 and 8, which compare
records of GPR reflectors and
diffractions with the plotted EMI
0
0
response.
Figure 7 shows GPR and EMI
1
20
data recorded along transect 02.
The pre-excavation profiles (top
2
and middle) show two large areas
40
of disturbance starting at about
3
12 m depth. Many hyperbolic
60
diffractions extend both to the sur-
face and to a sloping subsurface
4
80
horizon. These events are inter-
Post-excavation GPR
preted as metallic, because of their
relatively high amplitude, the
Figure 7. Profiles recorded along transect 02 (area A-4) with GPR and
presence of diffractions, and the
EMI. The data were recorded before (1994) and after (1995) excavation.
polarity of the reflections, which
3
The excavation, based on the 1994 survey results, revealed 5 yd
indicate a high dielectric permit-
1
3) of scrap metal and other debris near the broad, low amplitude
(3 2 m
tivity (which can also be associ-
anomaly. Several 5-gal. (19-L) pails, funnels, and oil-contaminated soil
ated with high conductivity). The
areas were revealed near the sharp anomaly at station 28 m.
pre-excavation EMI profile con-
7


 Previous Page
