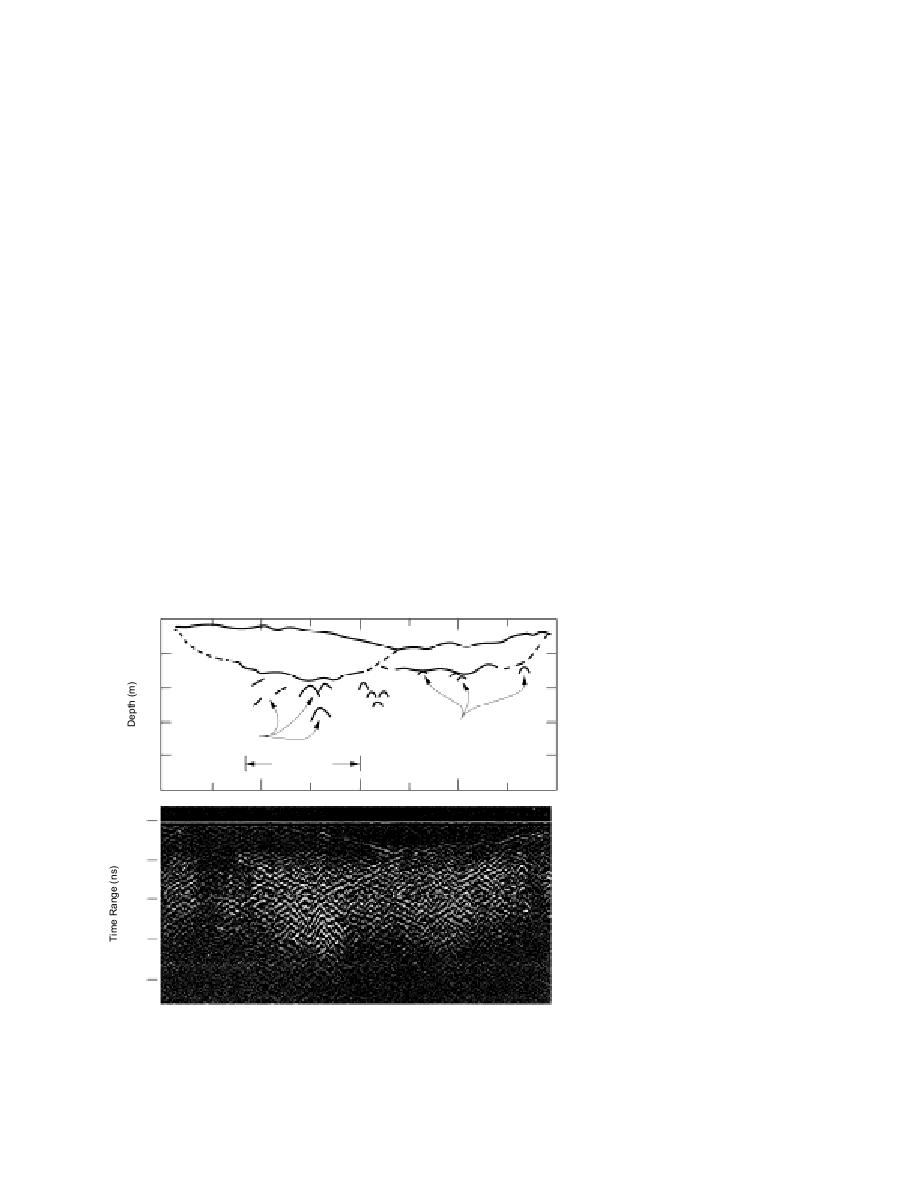
may be an older buried fill or a former ground
and one additional profile extended into wooded
surface. Numerous hyperbolic returns below this
terrain on both sides of the cleared area.
second surface likely represent large objects that
Two 400-MHz GPR profiles and interpretive
are from 1.5 to 3.0 m deep. The portion along this
cross-sections, representative of most of the data,
transect where EMI anomalies exceed 50 mV is
are presented in Figure 12. Many of the GPR pro-
shown in the schematic section and GPR dif-
files from the areas east of the baseline exhibit one
fractions within this zone are consequently
or two irregular horizons. The uppermost hori-
labeled as originating from metal objects; other
zon represents the land surface prior to filling
diffractions presumably result from rocks or non-
and grading in 1994. A second, deeper horizon
metallic objects.
exists on some profiles and may be either a bur-
The profile in Figure 12b was recorded along a
ied soil horizon that existed before burial activi-
transect traversing northeastsouthweast along
ties in the 1950s or the base of former excavations.
the axis of area T-1 (Fig. 11). Event marks along
Zones of intense (high-amplitude) diffractions are
the horizontal axis correspond to line intercepts
present within areas T-1 and T-2 where EMI
and are thus spaced approximately 6 m apart.
anomalies are mapped. The areal extent of the
Numerous diffractions appear between 0 and 18
radar anomalies exceeds the mapped EMI fea-
tures, suggesting burial of nonmetallic debris or
m distance below the horizon, representing the
small metal items that are too deep for detection
1994 ground surface. The lower limit of these
with the EM-61.
returns lies at approximately 3 m depth. A zone of
near-horizontal reflections at approximately 1.2 m
The profile in Figure 12a was recorded along
depth between 18 and 36 m distance may repre-
transect 04A and crosses area T-2, extending east
sent a layer of buried debris, or possibly an abrupt
from the CRREL baseline for 40 m (Fig. 11). The
increase in water content (associated with an
uppermost subsurface horizon, between the
horizon of fine grain soil). Small diffractions be-
depths of 0.25 and 1.0 m, represents the ground
low this horizon are visible to about 2.5 m depth.
surface prior to backfilling in 1994. Reflections
The portion along this transect where EMI anoma-
below this horizon, from 0.25- to 2.0-m depths,
West
Distance (m)
East
10
20
30
40
0
1994 Fill
Old Fill?
1
Old Fill?
2
3
Rocks or Non-
Metallic Targets?
metallic Targets?
4
EM > 50 mV
5
0
20
40
60
80
a. Transect 4A recorded in June 1995.
Figure 12. 400-MHz GPR profile and interpretative depth sections.
11


 Previous Page
