the same transect. Data were col-
lected along transects 2.5 and 5 m
apart in an eastwest and north
south grid pattern. A CRREL base-
N
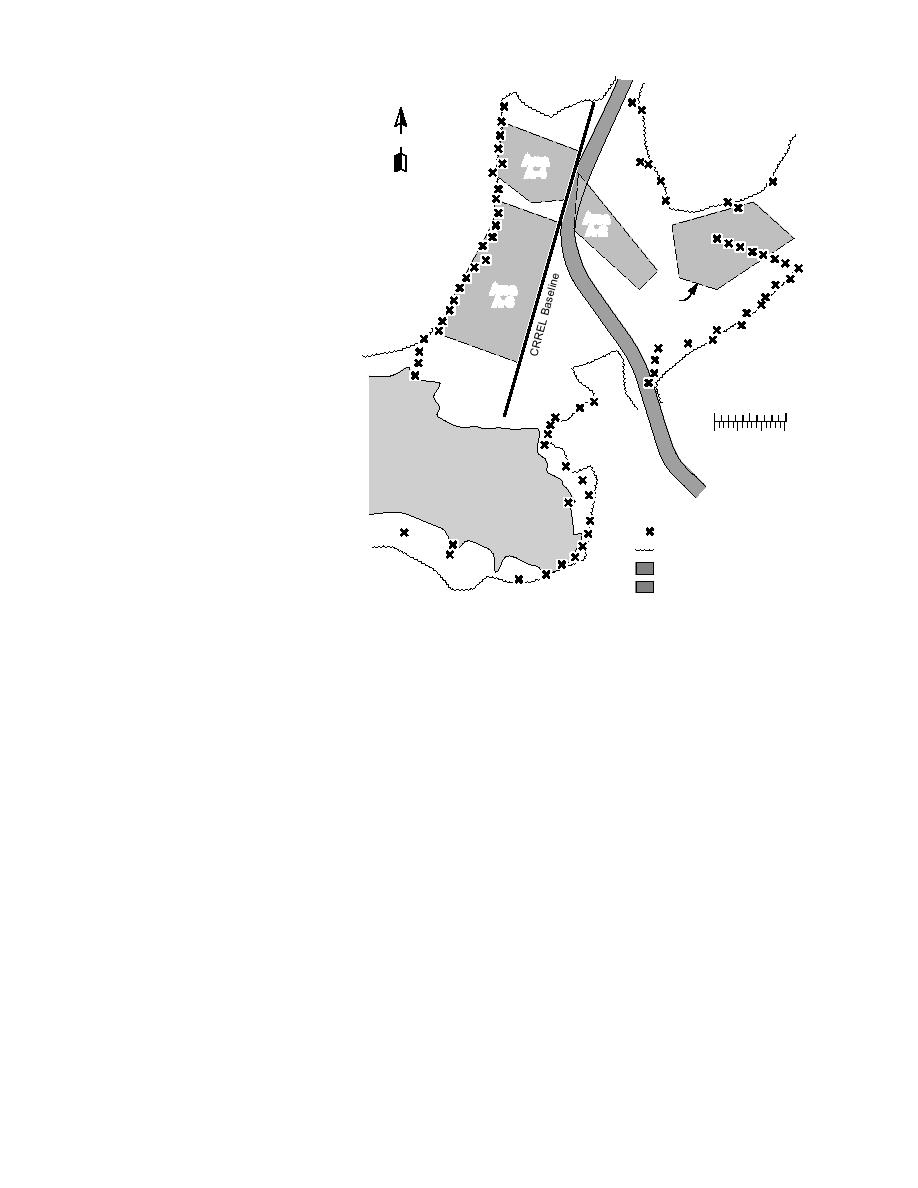
line (Fig. 5) was arbitrarily estab-
Area
lished, extending southsoutheast
A -4
from a birch tree adjacent to the site
access road, through monitoring
Area
well MW-5. Each transect end point
A -2
was staked. Event markers on the
radar profile correspond with the
5-m marks along each transect. The
Area
profiles were offset approximately
Area
A -3
A -1
1.5 m north or east of the grid lines
to avoid driving over stations marks.
Most of the GPR surveys used the
shorter pulse 400-MHz transducer
because it provided greater vertical
resolution than the 100-MHz trans-
0
50
100 ft
ducer.
0
10
20
30 m
Upon completion of the 1994 field
work, a level survey of the entire
area was performed and all transect
endpoints, intercepts, and addi-
tional marked stations were located.
During the late summer of 1994, the
End of CRREL Survey Line
mapped anomalies west of the
Tree line
CRREL baseline were excavated by
Marsh
OHM Remediation Services and all
Gravel Road
of the removed material was cata-
Figure 5. Entire Poleline Road Disposal Area showing the CRREL
loged (OHM 1995).
baseline and the end points of CRREL transects (x's). The dashed lines
Following those excavations, the
define the extent of GPR anomalies identified from the 1994 investiga-
entire PRDA was covered with a
tions. (After Lawson et al. 1994.)
silty gravel fill and subsequently
graded to a relatively smooth sur-
RESULTS
face. This smooth surface facilitated acquiring
geophysical data and improved transducer signal
Each GPR profile in the disposal area was
coupling into the ground in later surveys. How-
examined to define horizontal layering and the
ever, in some locations, fill thickness exceeded 60
location of subsurface diffractions, which might
cm. Signal loss within this additional fill and
indicate disturbance or the presence of buried
reflection at its bottom interface resulted in lower
objects, or both. These hyperbolic diffractions are
pulse amplitudes reflected from deeper targets.
important in attempting to identify areas in which
In June 1995, CRREL returned to acquire a sec-
larger metallic objects, such as cylindrical con-
ond data set. During this survey, the transducers
tainers, may be buried. This analysis was done
were towed by hand along this smoothed ground
independently of the EMI data analysis.
surface. The objectives of this second effort were
to verify that all hazardous buried material west
West of the baseline
of the CRREL baseline had been removed and to
The pre-excavation GPR profiles recorded along
refine the survey east of the baseline with a more
transects west of the baseline defined two large
closely spaced grid. The adjacent marsh south of
anomalous areas, A-3 and A-4. Those areas are
the main study area was surveyed only in 1994,
delineated by the dashed lines on Figure 5. Pro-
and as no significant anomalies were discovered
files within these areas are characterized by mul-
(Lawson et al. 1994), there is no additional discus-
tiple, strong hyperbolic diffractions and sloping
sion provided.
5


 Previous Page
