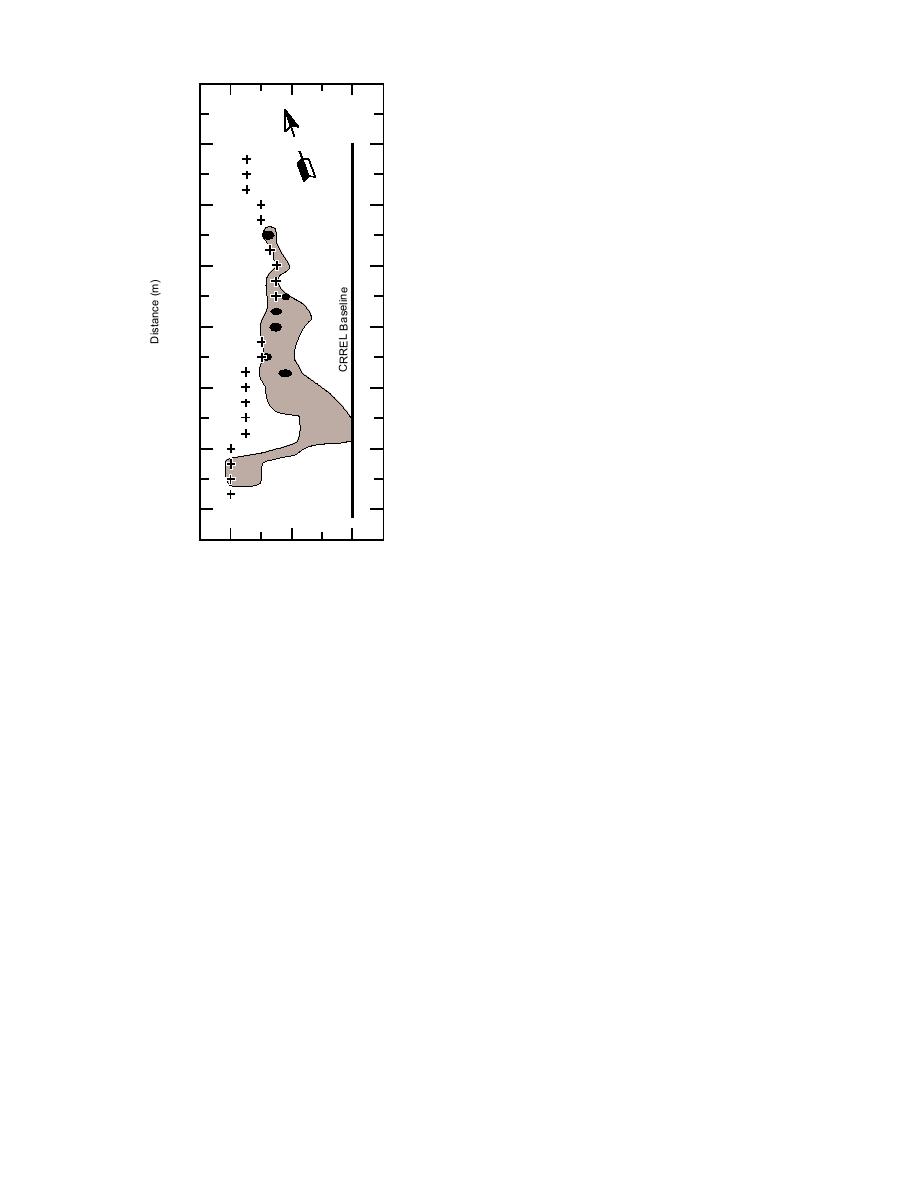
anomaly graded into a broad, low amplitude
20
response several meters towards the west, which
we interpret to be a relatively small amount of
refuse buried adjacent to the monitoring well. Two
0
N
broad, low-amplitude anomalies on transects 16
L000
and 17, between approximately 20 and 25 m west
L00
L01
of the baseline, suggest buried material. The
20
L02
remaining low-amplitude, narrow anomalies
L03
scattered across the area probably originate from
L04
small surface or near-surface trash (e.g., bolts and
L05
scraps of steel banding). Since the amplitude of
40
L06
the EMI anomalies is low and their positions do
L07
L08
not coincide with the GPR anomalies, it is likely
L09
that the remaining GPR anomalies result from
60
L10
inhomogeneous geological materials (e.g., large
L11
boulders within gravels and sands, typical of such
L12
glacial deposits).
L13
80
L14
L15
East of the baseline
L16
Our objective in the 1995 investigation was to
L17
define more precisely the location, extent, and
100
L18
depth to targets east of the baseline, which were
L19
not excavated. During the 1994 investigations,
L20
GPR and EMI data were collected on a 5-m grid
L21
120
while the site was snow covered. The 1995 data
were recorded on a 2.5-m grid and we focused on
two suspect areas delineated by previous investi-
40
20
0
gations. The transects retain the numbering used
Distance (m)
during the 1994 survey, and those with an "A"
Figure 9. Anomalous zones west of the
extension were located between existing transects.
CRREL baseline as interpreted from
The EMI and GPR data gathered in 1995 are con-
the June 1995 survey. It is likely that
sidered superior in quality and accuracy to those
this zone represents reflections from
gathered in 1994; therefore, only the 1995 results
large boulders within the sands and
are discussed.
gravels (transects are numbered L000
The results of the EMI survey are shown in
to L21).
contour maps in Figure 11. The two maps are
derived from the same data set but are contoured
material. Several of the profiles show dramati-
at different intervals. The bottom map in Figure
cally the interruption of horizons and scattered
11 locates low-amplitude EMI anomalies while
returns resulting from the 1994 excavations and
the top map locates higher amplitude ones. Areas
backfilling (Fig. 10). Profiles from transects 0913
of intense EMI anomalies (more than 200 mV)
also lack returns to 5 m depth in an area that
compare favorably with the 1994 data, although
extended from the baseline to about 15 m west of
the amplitude of the 1995 readings is lower
it. West of 1517 m, each one of these profiles
because of the addition of 0.5 to 1.0 m of silty fill.
exhibits sloping horizons and diffractions at
Two specific areas of intense EMI anomalies,
depths of from 1 to 3.5 m.
identified as T-1 and T-2, were marked in the field
Several of the EMI anomalies mapped prior to
for location by a survey crew.
excavation (Fig. 6) exceeded 1000 mV in ampli-
GPR data were collected using both the 100-
tude. After excavation, the 1995 EMI survey re-
and 400-MHz transducers. The 400-MHz data
vealed no significant anomalies in this area and
were recorded on every transect within the
amplitudes at all stations were less than 100 mV.
defined areas of interest, and the 100-MHz data
Levels between 40 and 90 mV, at the east end of
were recorded on selected transects. Additionally,
transects 14 and 15, probably resulted from the
400-MHz profiles were recorded on three transects
steel casing around monitoring well MW-5. This
parallel to the long northeast axis of area T-1,
9


 Previous Page
