Slack
H
Tigh
ide
Peak
Runout
Time
Sedimentation Decreasing with Time
S Optimum
edimentation
C
onditions
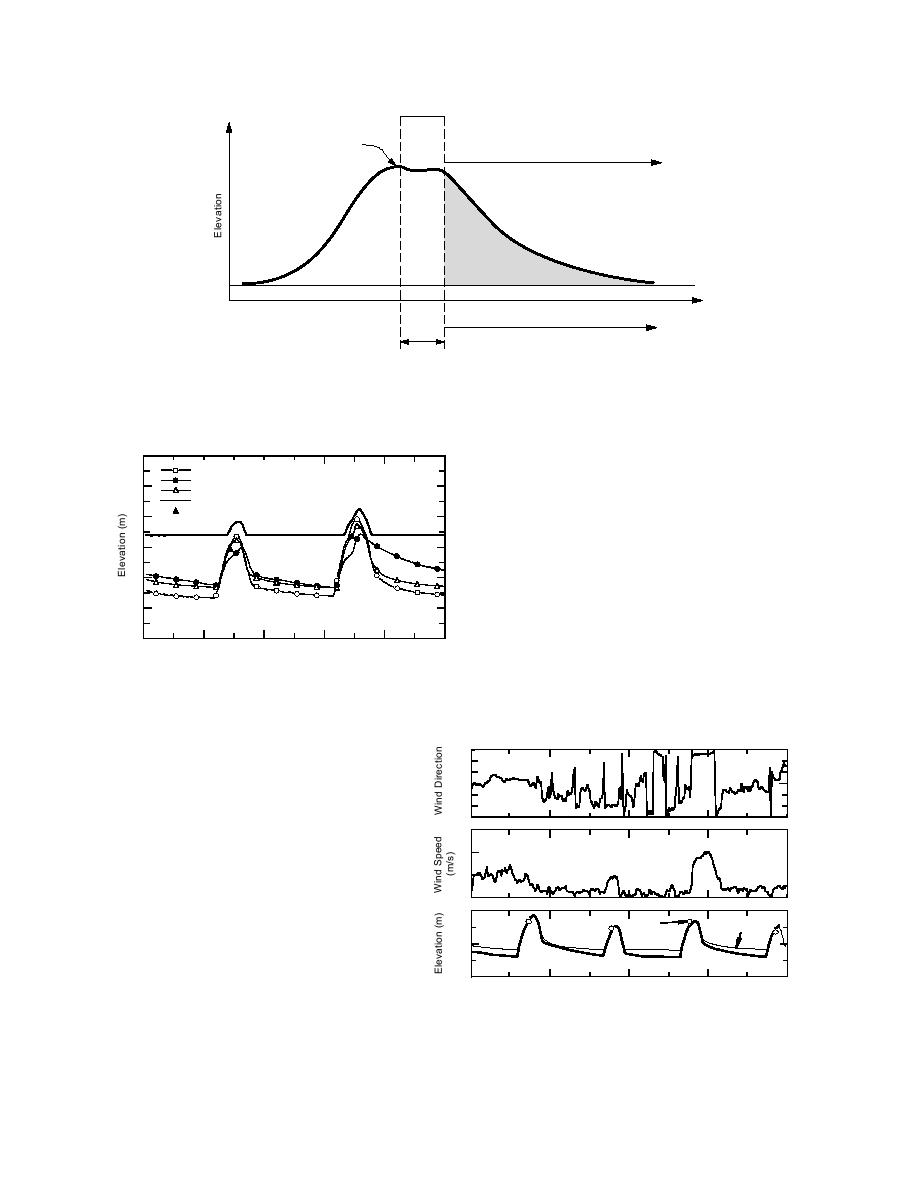
Figure 22. Typical high-tide curve showing period of sedimentation.
8
tidal height for Anchorage by more than 0.9 m in
Bread Truck Gully
some events (Fig. 23).
Otter Creek
Parachute Gully
During periods of lower high tides, water
River
Anchorage Predicted
depths matched well with the predicted Anchor-
6
age high tide values. Strong winds in Knik Arm
and Cook Inlet can, however, cause either a high-
er or lower high tide elevation, depending on
4
wind direction. As an example, let's observe two
tidal events during the nights of 67 October that
were predicted to be of the same height (Fig. 24).
On 6 October, strong southerly (180) winds blow-
2
00:00
12:00
00:00 (hr)
ing up Cook Inlet into Knik Arm amplified tide
6 Oct 1994
6 Oct 1994
7 Oct 1994
height on the Flats; however, in the latter case,
Figure 23. Water elevations as measured by pressure
northerly winds off the Flats produced a peak
transducer for two flooding tide events.
360
tually reverse its flow direction in the
upper Flats. This damming effect causes
180
the water of the river to rise higher than
the elevation of water in the gullies and
0
reverses flow in the drainage system. We
15
saw this happen in September and Octo-
10
ber 1994 during flooding events with a
predicted high tide of at least 4.0 m. The
5
damming effect may be accentuated dur-
0
ing spring snowmelt or mid- to late-sum-
6
Tide
Parachute
mer runoff peaks caused by a large vol-
Prediction
4
ume of glacial melt in the Eagle River.
Water depths measured at the hydro-
Otter Gully
2
stations and the tidal gauge in Knik Arm
12:00
0:00
12:00
0:00
12:00 (hr)
6 Oct 1994
7 Oct 1994
7 Oct 1994
8 Oct 1994
8 Oct 1994
show that during the September and Oc-
Figure 24. Wind characteristics and effects on tide heights at
tober flood tides, the peak water eleva-
Parachute and Tanker gullies, 68 October 1994.
tion on the Flats exceeded the predicted
24


 Previous Page
