Completed Sub-
Birch Hill
permafrost Well
Completed Shallow
Monitoring Well Cluster
Picket Well
Road
Tank Farm
Railroad
October
Ground Water
November
Flow Vectors
December
C-12
oad
C-1
lR
il
H
Quarry
ch
C-5
P-1
r
Bi
C-2
C-6
P-2
C-7
C-3
C-4
C-9
c. 30-m wells.
N
P-3
C-8
C-11
P-10
P-4
P-5
P-18
P-9
P-7
d
rR
e
Riv
P-0
School
Che n
a
R
Tr
ai
Shannon Park
no
rG
Subdivision
ate R ad
o
ROLF
0
200
400 m
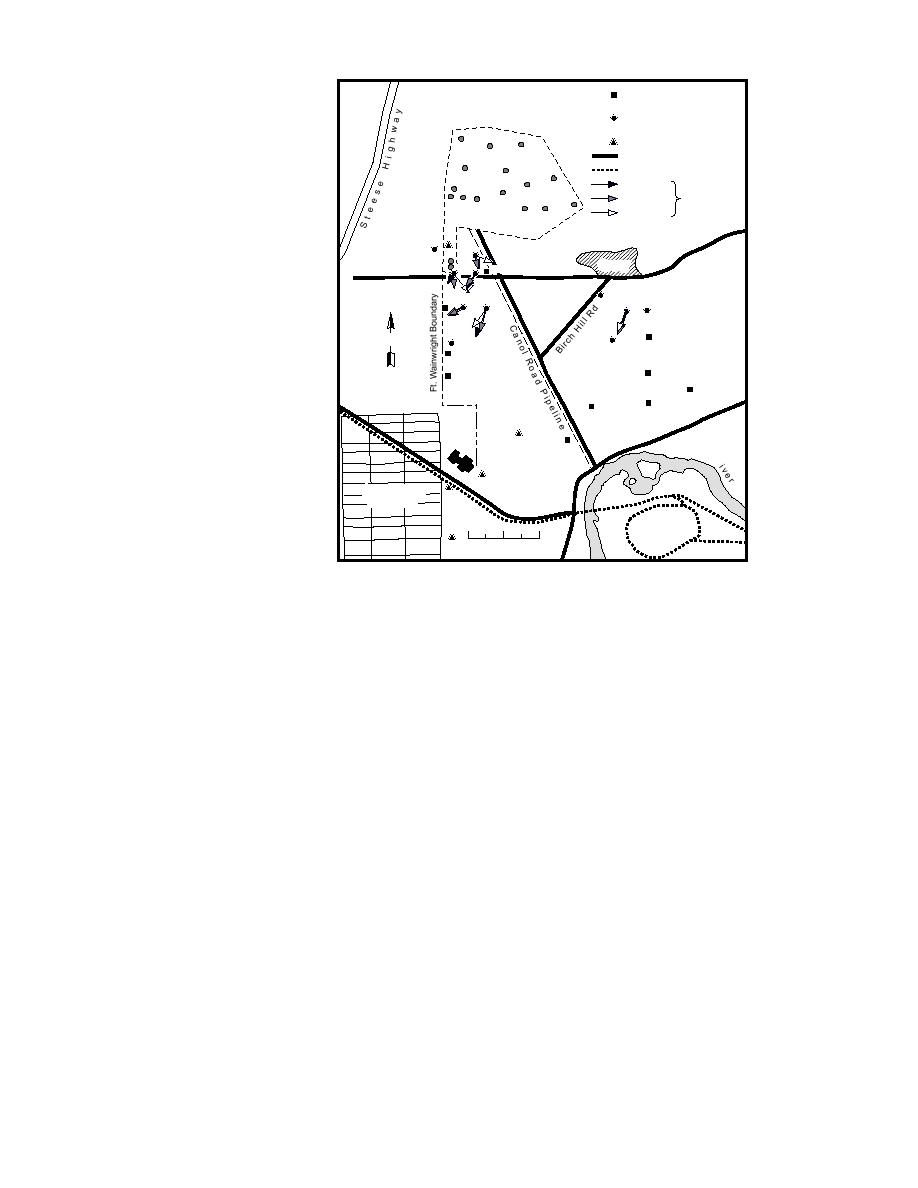
Figure 18 (cont'd).
tributable to the current probe calibration in a
ity is apparently a function of the confining effect
standard no. 812 sand mixture.
of permafrost. Certain wells, notably MWC-12, had
The 30-m-deep wells have fairly consistent
a reversal in flow direction within this period.
seepage velocities and directions of flow, while
The flow data from early to mid-winter indi-
the 20-m-deep wells exhibit slightly greater vari-
cate that seepage directions and velocities vary
ability in direction from month to month (Fig.
with well depth, this variability apparently re-
18). Velocities remain fairly constant but at a
flecting the proximity and geometry of the per-
rate greater than those of the 30-m depth. The
mafrost. Surrounding and confining permafrost,
20-m well data exhibit a mostly southsoutheast
which extends from about 25 to 35 m below the
flow pattern within thaw zones that trend
surface, locally controls flow directions, while in-
mainly northwest to southeast (Fig. 18b). East-
teraction with the subpermafrost aquifer of the
ern trending directions of flow (e.g., MWC-1,
area may induce highly variable horizontal and
MWC-12) are consistent with well locations within
vertical gradients and seepage rates. Directions
thaw zones that trend mainly east to west (Fig. 15
of flow may therefore deviate greatly from the
and 18c).
subregional pattern of flow (e.g., MWC-12, MWC-
Data from the 30-m-depth monitoring wells
1, Table 1). The variability in the 10- and 20-m
exhibit a south to southwest pattern with veloci-
well data are consistent with their location within
ties ranging from about 0.5 to 1 m/day (Fig. 18c
thaw zones bounded by permafrost. In contrast,
and 19c). These data vary little from month to
the more consistent flow pattern of the 30-m-depth
month. Their consistency in direction and rate
wells probably reflects the overall flow pattern of
probably reflects their location at or below the
the deeper aquifer in this area because measure-
base of the permafrost.
ments are close to the bottom of the permafrost.
The patterns exhibited by the 10-m wells are of
These data also indicate that the hydraulic gradi-
much greater variability (Table 1) than those at
ent is controlled locally by an aquifer within or
either 20 or 30 m (Fig. 18c and 19c). This variabil-
north of Birch Hill.
19


 Previous Page
