Tensile failure and extension data from simple
Table 2. Tensile failure and extension data from simple
tension tests of various silicone joint sealants. (From
tension tests of various silicone joint sealants have
Spells 1987.)
been described in the literature by Spells (1987) and
are reproduced in Table 2. The sealants were des-
Force per unit
ignated by Spells as high modulus, medium modu-
unstrained area at
Sealant
extension ratio = 1.5
Extension ratio at
classification
(kPa)
breaking failure
10
1
10
10
High modulus
690
5
Medium modulus
276690
512
9
10
a.
10 0
Low modulus
276
12
10 8
(G1
1
Tan δ
10
Pa) 10
7
50
2
10
Fre( uency
q
6
lus, and low modulus sealants in order to demon-
10
500
Hz)
000
strate their range of deformation capabilities, and
10 5
10 3
were tested according to standard procedures
80
40
0
40
80
120
10
1
(ASTM 1991d) at near room temperature. For each
10
10
category the table lists the force per unit of the
9
10
b.
original, unstrained area at an extension ratio of
10 0
1.5, and the extension ratio at breaking failure.
10 8
(G
Very few data exist in the literature regarding
1
Tan δ
1
10
Pa) 10 7
the effect that temperature has on sealant proper-
ties, although in the rubber and polymer industry
2
10
6
10
such material property data are routinely gener-
ated for evaluating the effectiveness of the mate-
5
3
10
10
80
40
0
40
80
120
rial, and standard test methods are suggested for
10
1
10
10
obtaining the data (e.g., ASTM 1991c). One ex-
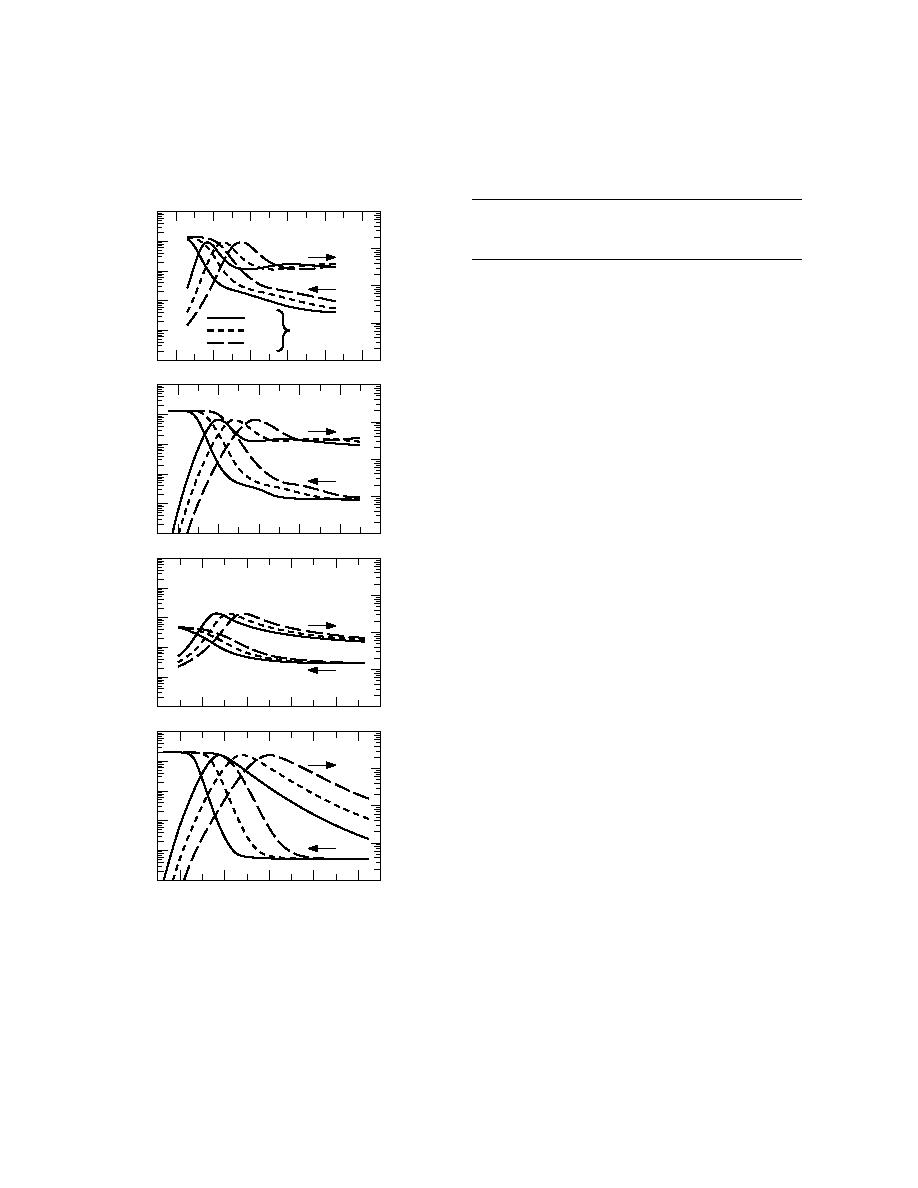
ample of shear modulus vs. temperature data from
9
10
c.
10 0
low-strain harmonic loading tests of a sealant is
10 8
shown in Figure 6. The data are for a polysulfide
(G1
1
Tan δ
10
sealant tested at three loading frequencies using a
Pa) 10 7
beam test, from a publication of Nashif and Lewis
2
(1991). The real part of the shear modulus G(G =
10
6
10
G1 + iG2) and the loss factor tan δ (tan δ = G1/G2)
5
3
are shown. Also shown from this publication, for
10
10
80
40
0
40
80
120
purposes of comparison, are corresponding data
10
1
10
10
sets for a polysulfide elastomer, a urethane elas-
9
tomer and a natural rubber.
10
d.
10 0
More general reviews of the characteristics of
8
10
sealants have been given by Panek and Cook (1984)
(G1
1
Tan δ
10
and the American Concrete Institute (ACI 1993).
Pa) 10
7
2
10
10 6
MECHANICAL
5
3
RESPONSE OF SEALS
10
10
40
80
80
40
0
Temperature (C)
The current state of knowledge of the mechani-
Figure 6. Examples of the real part of the complex shear
cal response of joint and crack seals comes prima-
modulus G (G = G1 + iG2) and the loss factor tan δ
rily from field and laboratory experimental stud-
(tan δ = G2/G1) as functions of temperature from low-
ies of the deformation capabilities of pavement and
strain harmonic loading tests of (a) a polysulfide seal-
building seals. As indicated by the extent of the
ant, (b) a polysulfide elastomer, (c) a urethane elastomer,
experimental work that is documented in the lit-
and (d) a natural rubber, all tested at three loading fre-
erature and by the concerns of the practitioners
quencies in beam tests. (After Nashif and Lewis 1991.)
who are charged with sealing joints and cracks,
8


 Previous Page
