8
Test programs that incorporate these experimen-
tal configurations are sometimes devised to investi-
a.
gate material behavior, to calibrate phenomeno-
6
logical constitutive models of rubber elasticity be-
havior that can be used for material and structural
response calculations, and to verify predictions
4
made using the constitutive models.
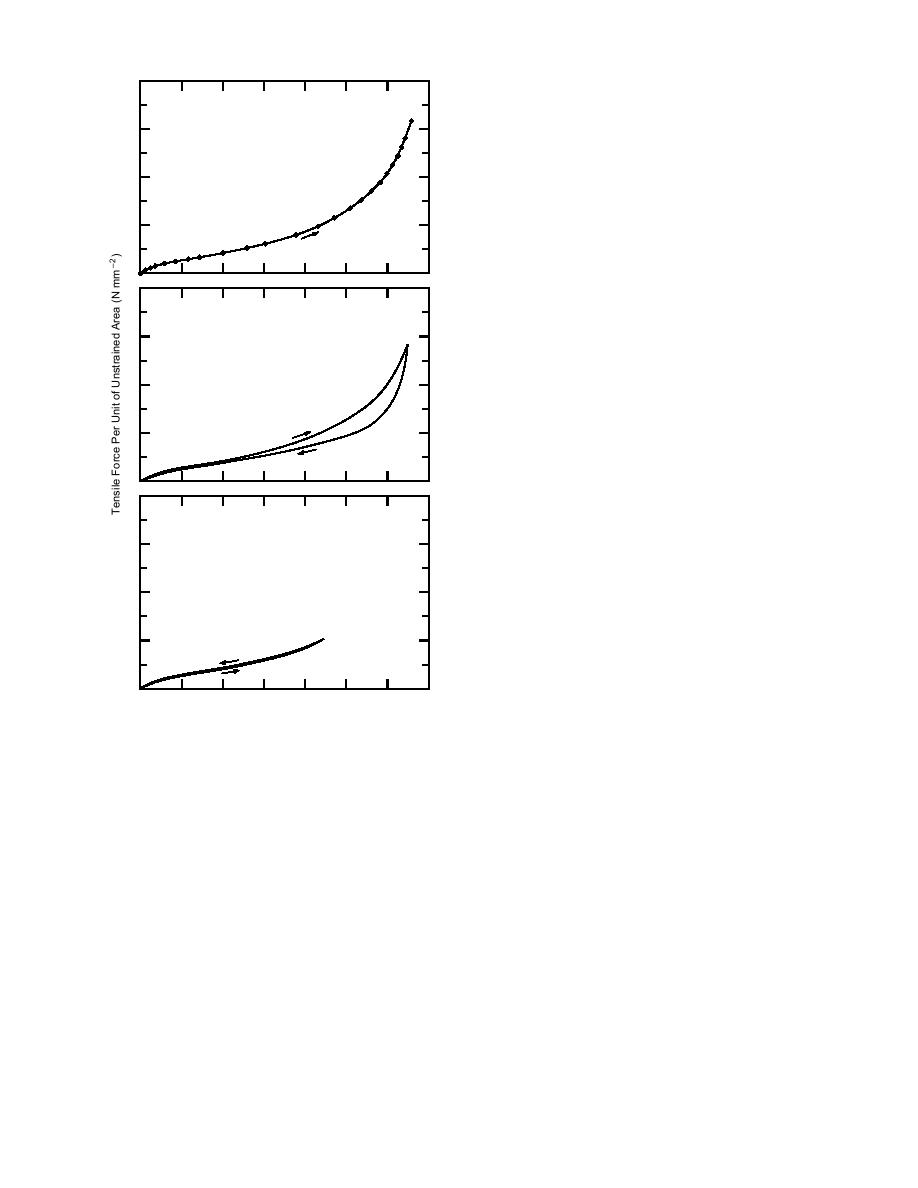
Simple tension tests of elastomers yield re-
2
sponse curves like those shown in Figure 1. The
figure relates force per unit of unstrained area to
extension ratio, which is defined as the deformed
0
specimen length normalized by the undeformed
8
specimen length. The data in the figure are for a
vulcanized natural rubber tested at room tempera-
b.
ture, and are published by Treloar (1975).
6
Figure 1 includes the force-extension ratio re-
sponses measured in three simple tension tests.
4
Curve (a) illustrates the response of a specimen
that was loaded to failure, whereas curves (b) and
(c) illustrate the responses of specimens that were
2
loaded and unloaded without failure. Based on the
curves (b) and (c) Treloar (1975) noted that up to
an extension ratio of about 5.5 the material response
0
was substantially reversible, but that loading to a
8
higher extension resulted in significant hysteresis.
c.
Curve (c) illustrates clearly the low resistance, high
6
extension, nonlinear elastic response that is the
characteristic feature of the behavior of rubber ma-
terials. For example, it is roughly the behavior of
4
the material of a rubber band when stretched.
Implicit in this description of an elastomer is a
temperature range for which rubber-like behavior
2
occurs. The transition from rubbery to glassy be-
havior (the glass transition) is often characterized
0
by a single temperature, although, unlike a crys-
1
2
3
4
5
6
7
8
talline material, the mechanical behavior changes
Extension Ratio
gradually over a temperature range. The transition
Figure 1. Results from three simple tension tests of vul-
occurs because the chains of the amorphous mo-
canized natural rubber. (After Treloar 1975.)
lecular network become less flexible with decreas-
ing temperature until the structure is rigid. Figure 2
men configurations. Traditionally, for obtaining ma-
illustrates the changes in the load and extension
terial stress-strain data under homogeneous stress
response that are typically observed in polymers
and deformation conditions, load and deforma-
that are tested in simple tension tests at different
tion responses have been measured in simple ten-
temperatures. Only above the temperature range
sion, equibiaxial tension and pure shear tests. Tor-
of the glass transition will a polymer in simple ten-
sion tests, which inherently generate inhomogen-
sion tests deform with homogeneous strains and
eous stress and deformation conditions, can pro-
behave like an elastomer (Ward 1983). Within and
vide material stressstrain data as well (Penn and
below the transition range the deformation will not
Kearsley 1976), by using a technique for calculat-
be homogeneous, and ductile or brittle failure can
ing material stressstrain data from the measured
occur. The figure illustrates that a material in-
torque and axial force of the torsion sample (Kears-
tended for use as an elastomer will actually be-
ley and Zapas 1980). For standard comparative
have as a stiff and perhaps brittle material when
measures of material properties the simple tension
its temperature is below the glass transition tem-
configuration is often used (e.g., ASTM 1991d).
perature.
4


 Previous Page
