Bread Truck Drainage
42.40 m
Elev.
5.05 m
6.55 m
4.09 m
Irregular
Channel Cross-section
Approximate
Channel Cross-section
Parachute Drainage
33.02 m
Elev
15.90 m
4.95 m
2.44 m
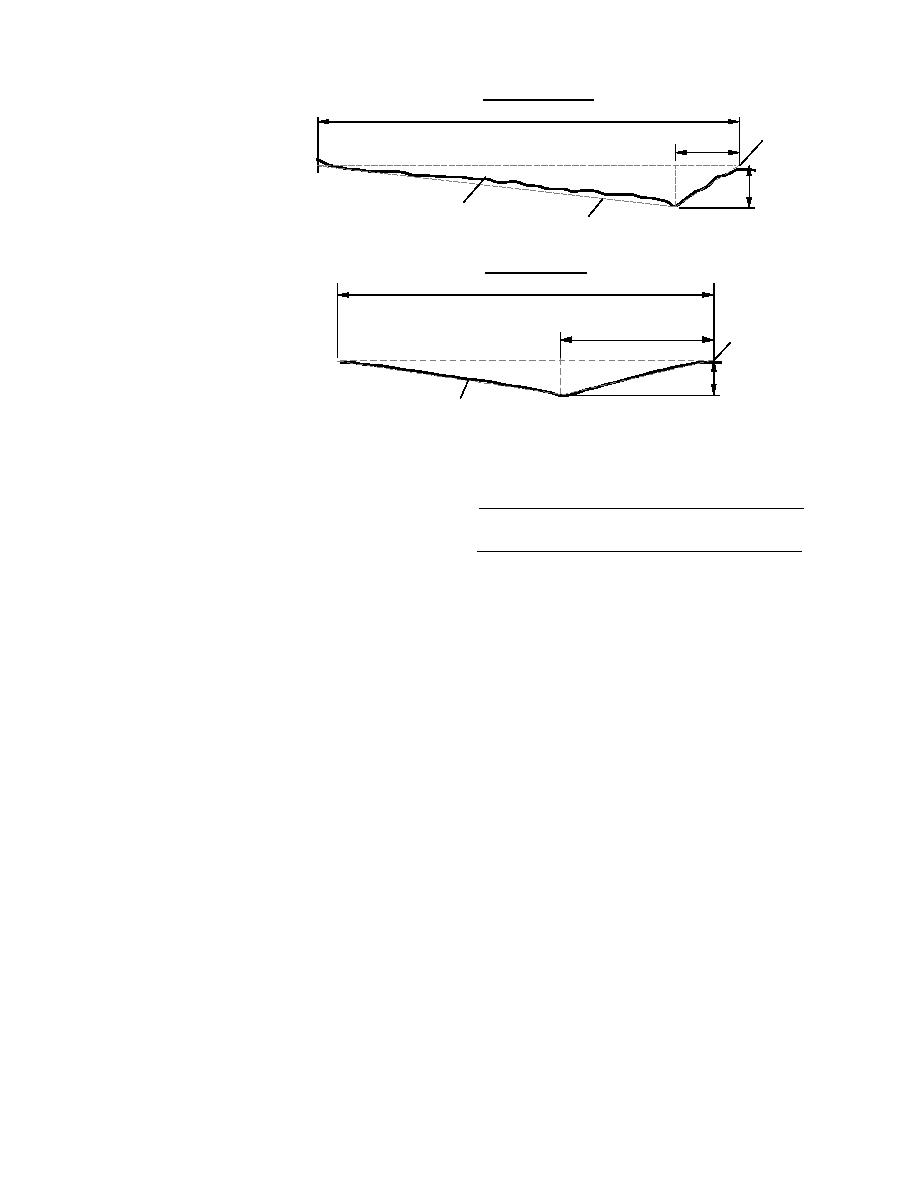
Figure 29. Idealized cross sections at the
Approximate
Bread Truck and Parachute drainages.
Cross-section
steep gradient suggest that the drainage system
Table 5. Gully parameters.
is actively changing. The reasons for this activity
A
Pw
R
S
are not yet clear. Hydraulic and geotechnical
(m2)
Location
(m)
(m)
(m/m)
N
forces are clearly causing such changes, but their
Bread Truck drainage
86.7
43.8
1.98
0.0044 0.018
relationship to the dynamics of the entire system
Parachute drainage
40.3
33.4
1.21
0.0062 0.018
remains unknown. Basic parameters such as cur-
S = slope.
rent velocity, discharge and channel geometry
need to be measured accurately to define the gul-
Table 5 gives values of the above parameters, as
lies' roles in tidal flat hydrology.
well as area (A) and wetted perimeter (Pw). We
To evaluate the potential magnitude and rela-
assumed that the depth of flow was at bankfull
tive importance of forces causing erosion and
stage and that the channel slope in the gully was
sediment transport within the gullies, empirical
in uniform flow. These calculations produced
equations were used to estimate hydraulic pa-
very high flow velocities (more than 4.5 m/s) and
rameters for peak flow during ebb. Gully pro-
Froude numbers in excess of 1.0. Since these val-
files, bank elevations and calculated slopes for
ues indicate supercritical flow, the flow must un-
the Bread Truck and Parachute drainages were
dergo a hydraulic jump to a greater depth, which
used to approximate the shape of the drainage
is not possible for the assumed bankfull condi-
cross section and estimate maximum velocities
tions. Thus, simplifying the hydraulic conditions
and discharge (Fig. 28 and 29).
to a uniform flow assumption is not feasible for
Sediment transport and gully erosion are pri-
currents within the gullies.
marily related to the flow velocity. Gully longitu-
Obviously, these flow velocity calculations are
dinal profiles and cross sections were measured
not representative of the actual situation and
for the Bread Truck and Parachute drainages in
more detailed information on the hydraulic con-
an attempt to determine flow velocities in these
trols (downstream and upstream) or actual veloc-
channels. Figures 28 and 29 are representative
ity measurements are needed. Our observations
sectional shapes that expand in each gully as one
suggest flow velocities are actually in the 13 m/s
proceeds downstream.
range during ebb.
The Manning equation was used to calculate
the average flow velocity V in the gully.
EROSION AND RECESSION RATES
V = 1.0/N R2/3 S1/2
(1)
Erosion of gully headwalls is causing their pro-
where N = Manning coefficient (0.018 for clean
gressive elongation into the mudflats and pre-
earth)
sumably into the ponds. Rates of recession of the
R = hydraulic radius
gully headwall and adjacent lateral walls were
30


 Previous Page
