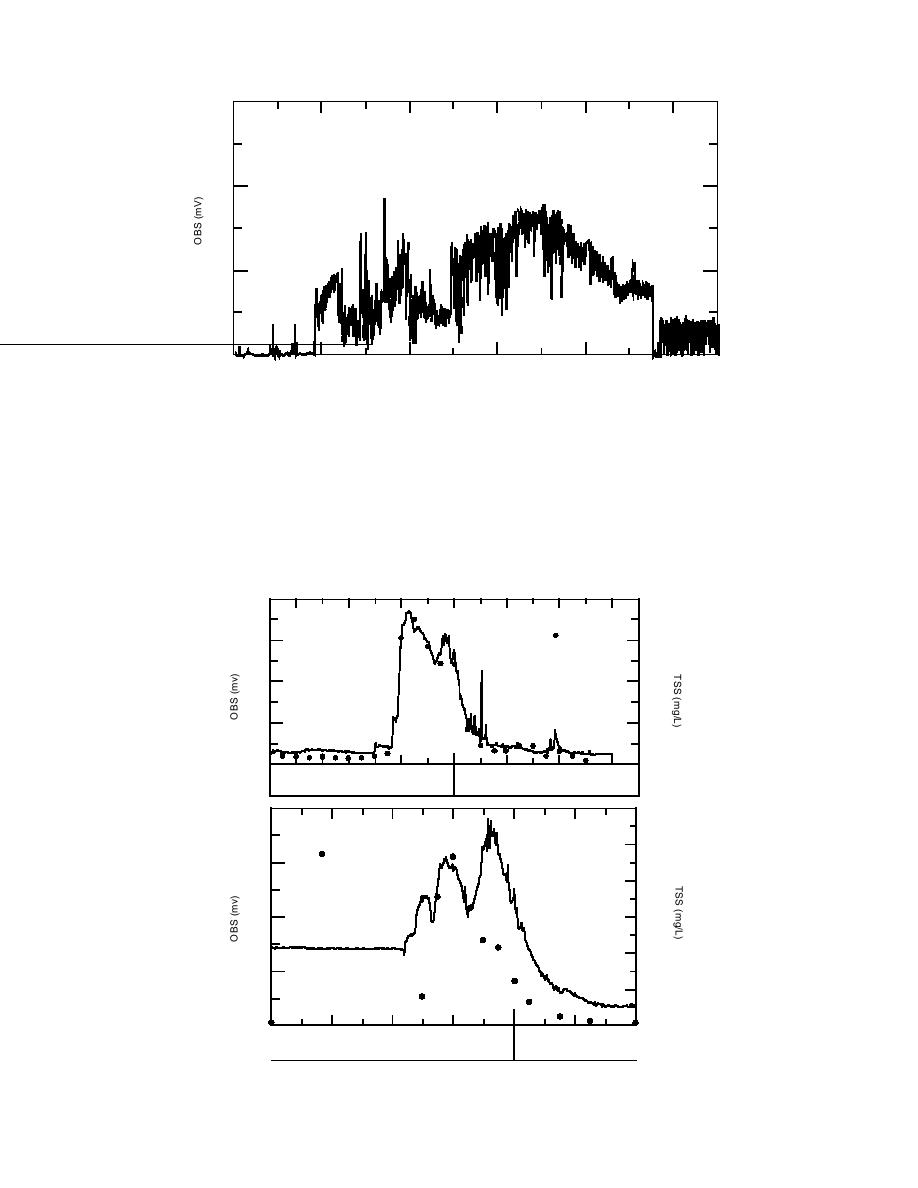
3000
Bread Truck Drainage
2000
V)
1000
d.
0
14 Sep '93
16
18
20
22
24
Figure 24 (cont'd).
on Knik Arm in September recorded peak val-
discharge can cover the sensor and cause a false
ues ranging from 1400 to 1800 mV (560 to 720
indication of higher turbidity. It should be noted
FTU). OBS readings were not obtained at Eagle
that because the withdrawal point for the suc-
River, however, owing to a lack of equipment.
tion sampler and the view of the OBS sensor are
As stated previously, the sporadic peaks in
not precisely the same location, local increases in
OBS turbidity at both gully sites may be impor-
suspended sediment by scour or bank failure
tant indicators of erosion in the gully headwall
may not be sampled by the suction technique. In
region, but vegetation or other objects in the ebb
addition, the optical character of the water may
1600
1600
Parachute Drainage
TSS
1200
1200
800
800
(
OBS
400
400
0
0
18:00
20:00
22:00
02:00
04:00
06:00
a.
20 Aug '93
21 Aug
800
2400
Parachute Drainage
2000
TSS
600
1600
400
1200
OBS
800
200
400
b.
0
0
16:00
18:00
20:00
22:00
02:00
04:00
18 Sep '93
19 Sep
Figure 25. Comparison of OBS and TSS measurements at Parachute Pond.
27


 Previous Page
